You don't need to learn Python to analyze data anymore.
That statement would have sounded absurd five years ago. Data analysis meant Excel formulas at minimum, and serious insights required coding skills that took months or years to develop. Business professionals who wanted to understand their numbers had two choices: learn to code or wait for someone technical to help them.
The landscape shifted dramatically. In 2026, AI tools have democratized data analysis to the point where a marketing manager can upload a sales spreadsheet, ask questions in plain English, and get professional visualizations with statistical insights in under a minute. A small business owner can identify revenue trends without knowing what a pivot table is. A nonprofit director can analyze donor patterns without hiring a data analyst.
This isn't about dumbing down data analysis. These tools run sophisticated Python code, perform statistical tests, and create publication-quality charts. They just handle all the technical work invisibly, translating your questions into code and your data into answers.
The result is a fundamental shift in who can work with data. According to recent industry research, tools like Julius AI have helped companies cut data analysis time from full days to under an hour. Teams that once waited on engineering or hired dedicated analysts now get insights immediately through conversational interfaces.
But not all AI data analysis tools are created equal. Some excel at visualization. Others handle complex statistical analysis. A few integrate deeply with existing business systems. Choosing the right tool depends on what you're trying to accomplish and how technical you're willing to get.
This guide covers the seven best AI tools for data analysis that genuinely work for non-coders in 2026.
What Makes AI Data Analysis Different
Before diving into specific tools, it helps to understand what changed.
Traditional data analysis tools like Excel,Tableau, or Python required you to know the mechanics. You had to understand which functions to use, how to structure formulas, or what code to write. The tool executed your instructions exactly as given, which meant you needed to give correct instructions.
AI data analysis tools flip this relationship. You describe what you want to know, and the AI figures out how to get there. Ask "which products are selling best in the Northeast region" and the tool automatically filters your data, performs the aggregation, and creates a visualization. You don't need to know that this requires a GROUP BY clause or a pivot operation.
The technical work still happens. These tools typically run Python code with libraries like pandas for data manipulation and matplotlib for visualization. But the AI writes that code based on your natural language prompts, executes it in a secure environment, and returns the results in a format you can actually use.
This approach has three major implications for non-technical users.
- First, the barrier to getting started dropped to nearly zero. Upload a file, ask a question, get an answer. No setup, no configuration, no learning curve.
- Second, exploration became conversational. You can ask follow-up questions, request different visualizations, or drill into specific findings without starting over. The AI maintains context across the conversation.
- Third, errors became recoverable. When code fails, the AI can interpret the error and fix it automatically. You don't need to understand what went wrong to get past it.
ChatGPT Advanced Data Analysis
ChatGPT's data analysis capabilities, formerly called Code Interpreter, represent the most accessible entry point for non-coders exploring AI-powered analysis.
- ChatGPT examines your data, understands its structure, and then responds to your questions by writing and executing Python code behind the scenes. You see the results, not the code.
- The range of supported file types is broad. Excel spreadsheets, CSV files, PDFs, and JSON all work. You can upload files up to 512 MB, with CSV files working well up to about 50 MB depending on complexity. For many business users, this handles the vast majority of analysis needs.
- You can start with a vague question like "what's interesting in this data" and follow the thread wherever it leads. The AI often suggests follow-up analyses you might not have thought to request.
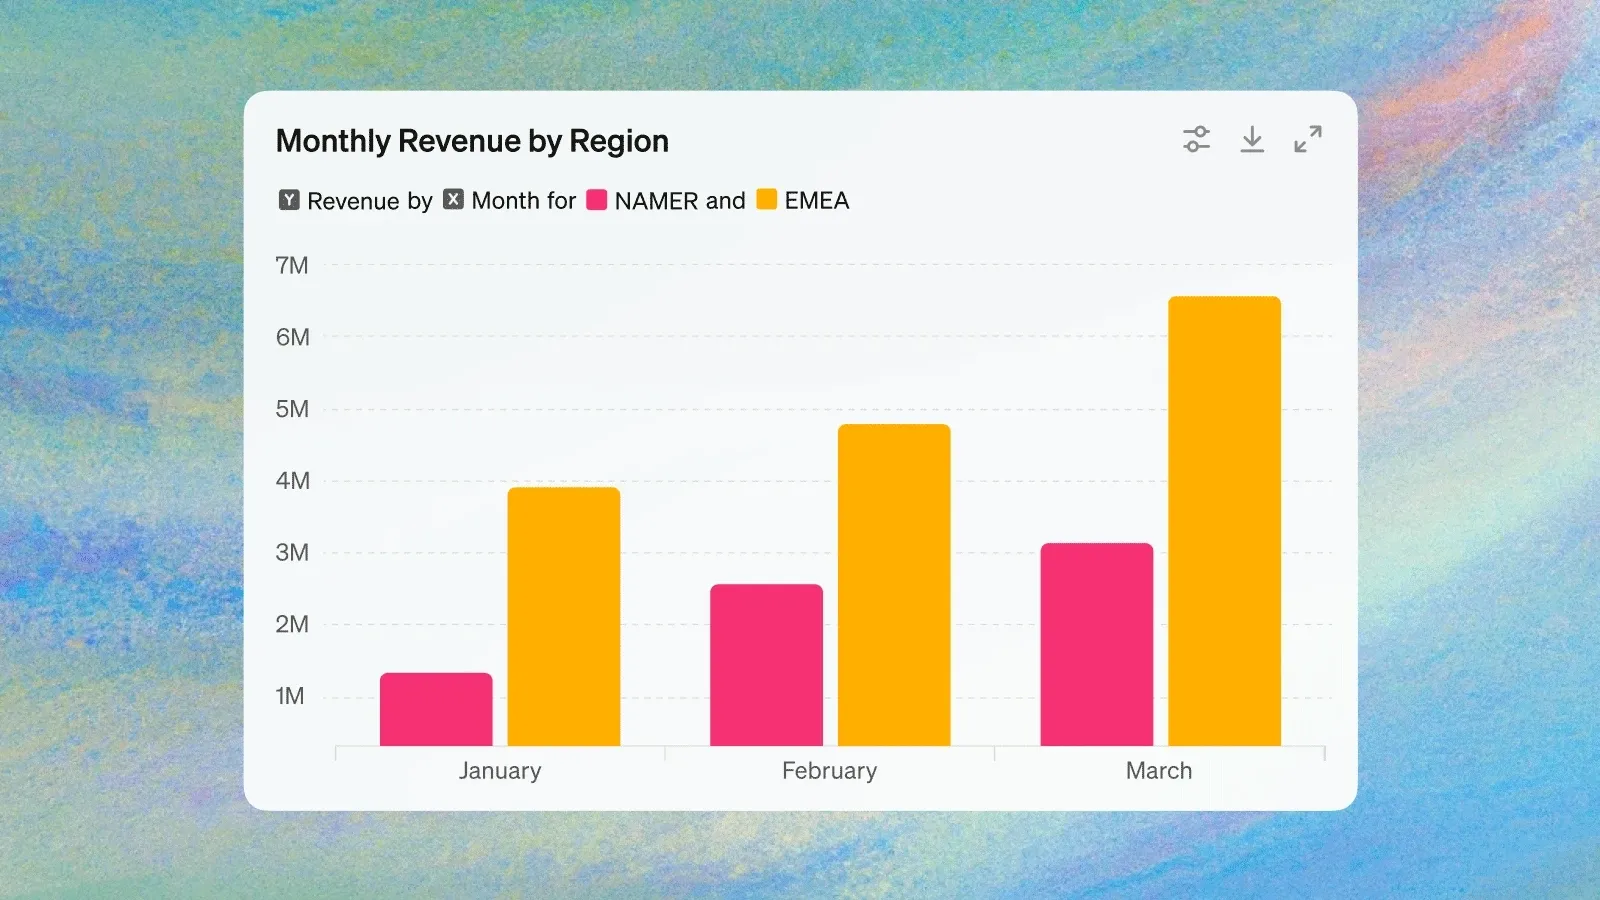
- ChatGPT can generate both static and interactive charts, automatically selecting appropriate chart types based on your data. Bar charts, line graphs, scatter plots, pie charts, and more complex visualizations are all available. You can customize colors, labels, and styling through conversational requests.
- Statistical analysis goes well beyond basic summaries. ChatGPT can run regressions, perform clustering analysis, identify outliers, and conduct hypothesis tests. It handles these complex operations through the same conversational interface, explaining results in plain language.
- The integration with Google Drive and Microsoft OneDrive means you can pull files directly from cloud storage without downloading first. This streamlines workflows for users already working in those ecosystems.
- Pricing requires a ChatGPT Plus subscription at $20 per month. The data analysis feature is included with that subscription and available by default in GPT-4o.
The main limitation is that ChatGPT works best for ad-hoc analysis rather than recurring reports. Each conversation starts fresh, and there's no built-in way to schedule automated analyses or connect directly to live databases.
Julius AI
Julius AI was built specifically for data analysis, and that focus shows in how well it handles business use cases.
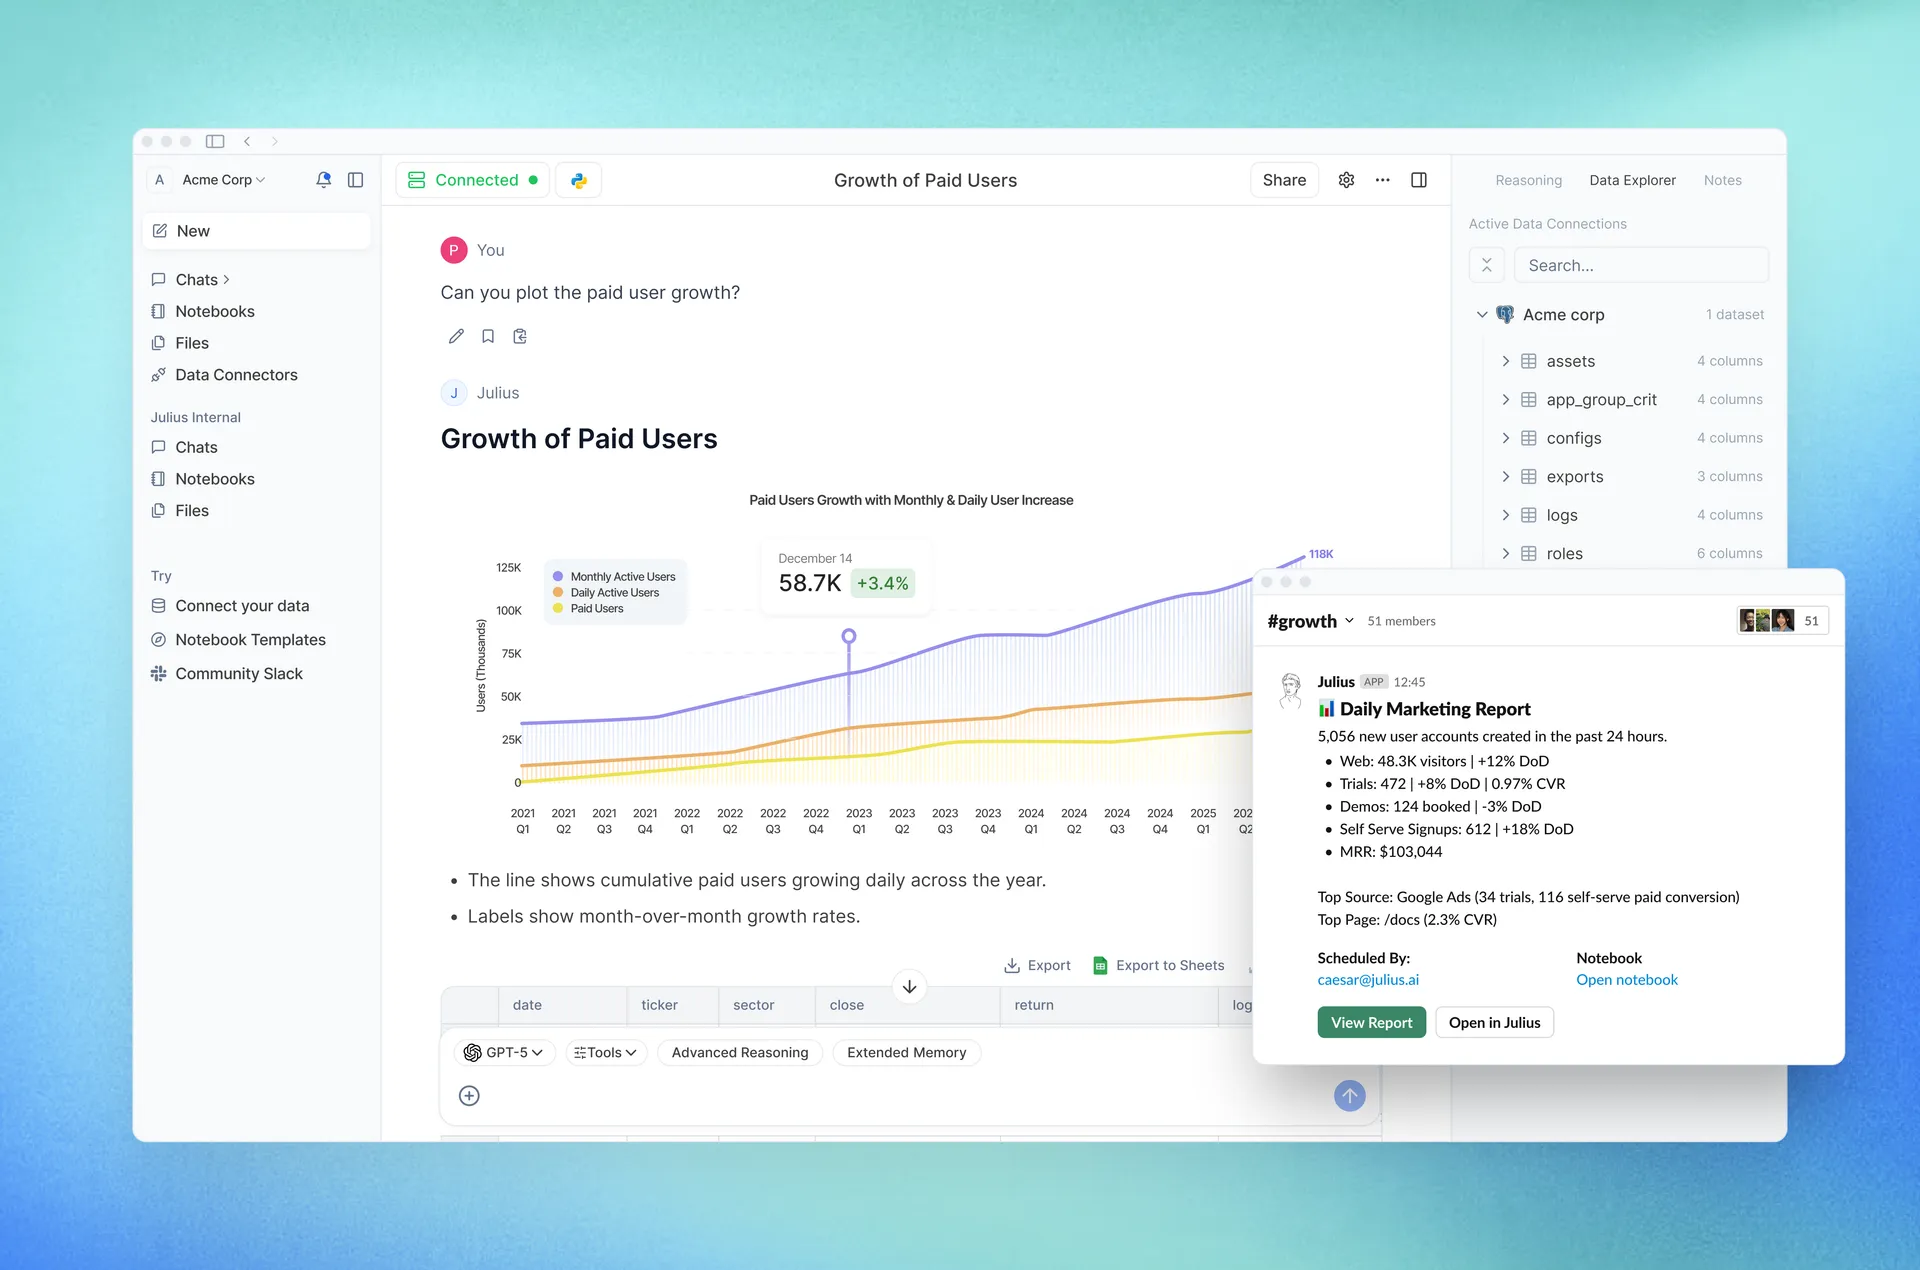
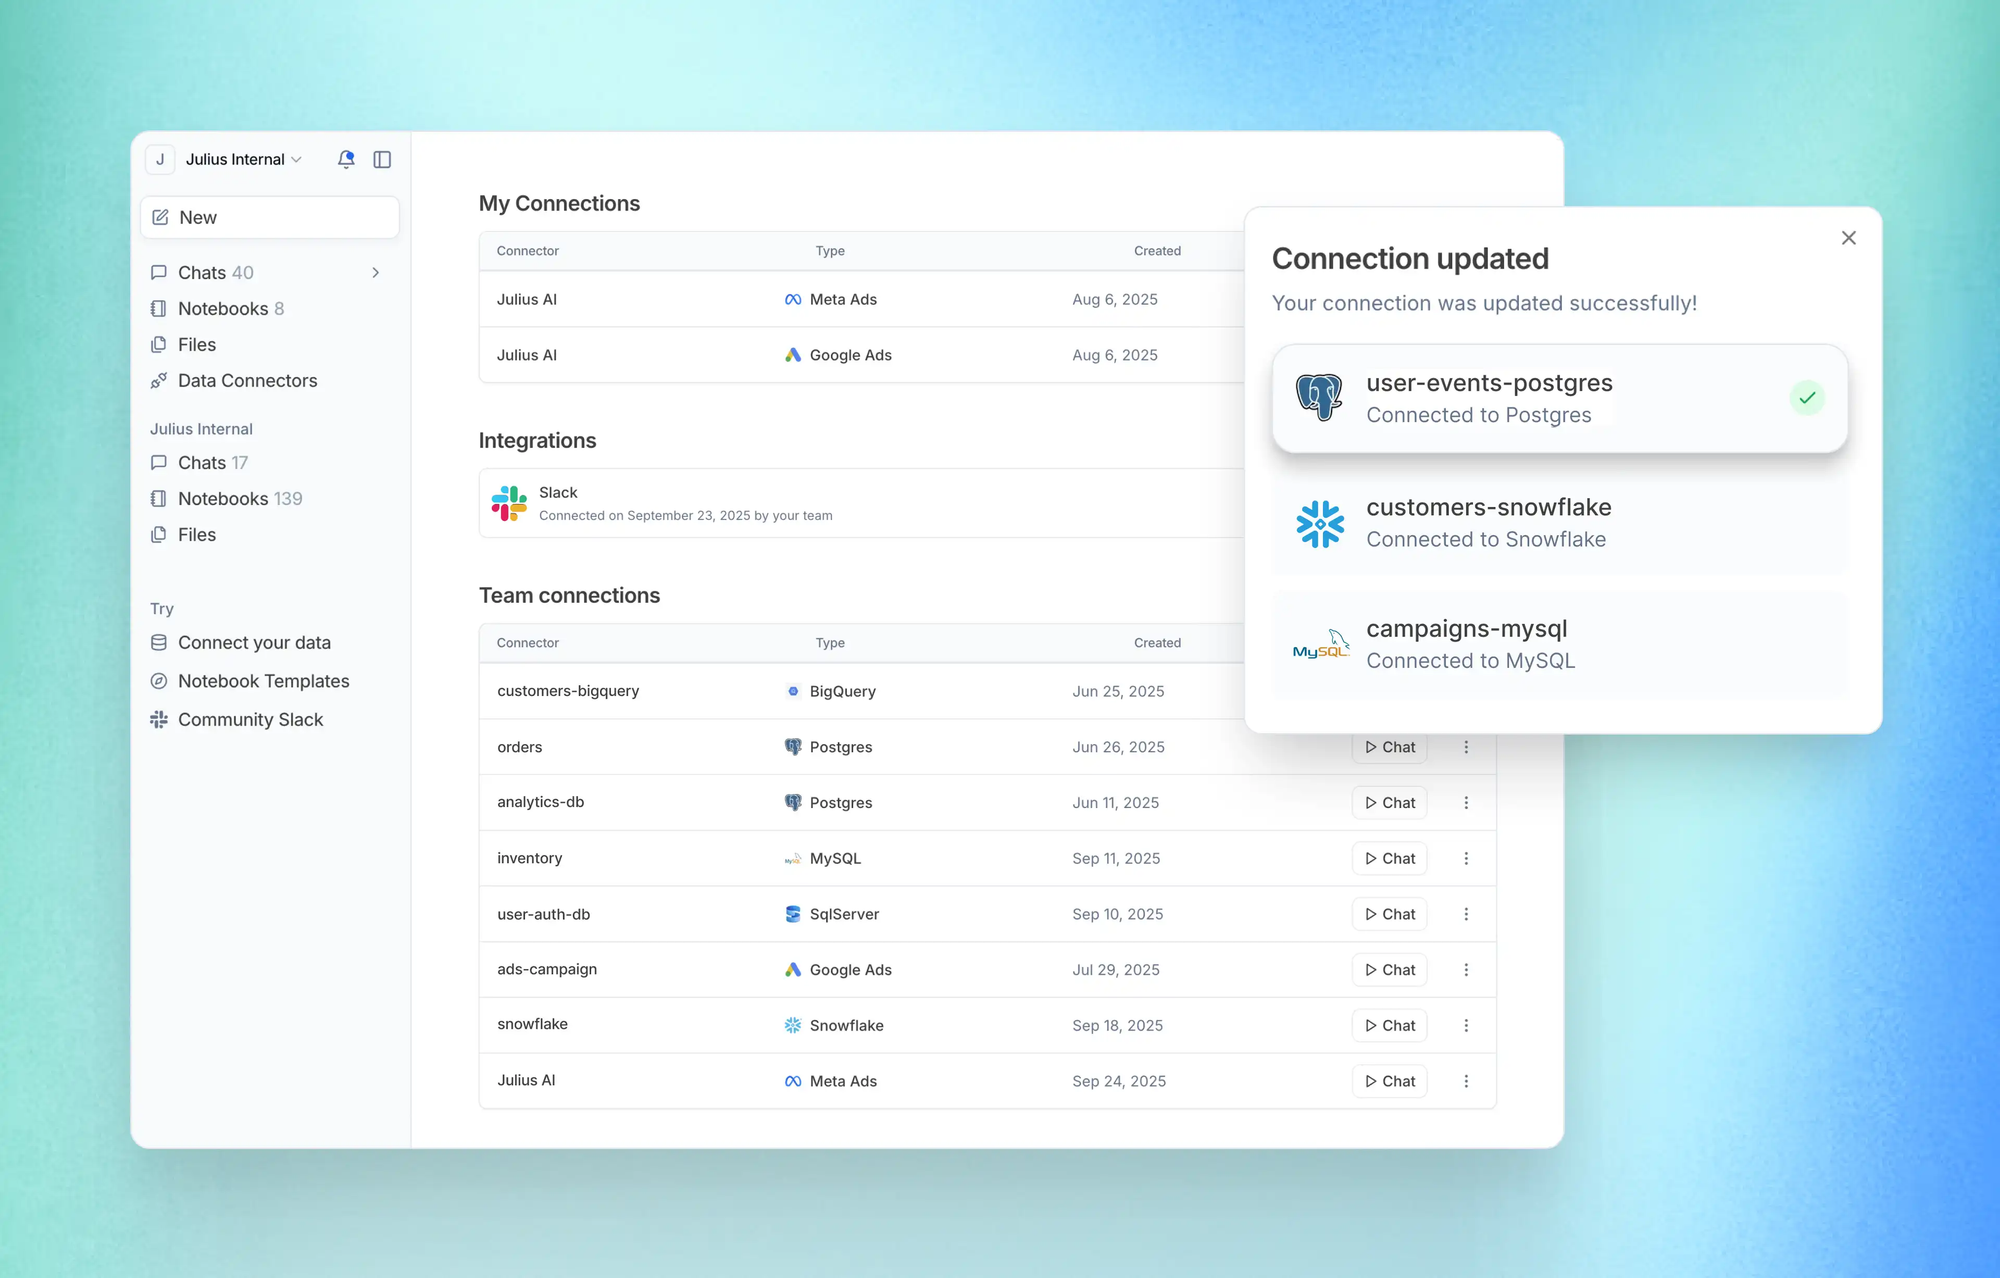
The core interaction model mirrors ChatGPT's conversational approach. Upload spreadsheets, CSVs, or connect to databases, then ask questions in natural language. Julius writes and executes code to answer your questions, returning visualizations and insights.
Where Julius distinguishes itself is in learning your business context over time. The platform gets better at understanding your data with every use, learning your business logic to surface more relevant insights. This contextual understanding reduces the need to explain your domain repeatedly.
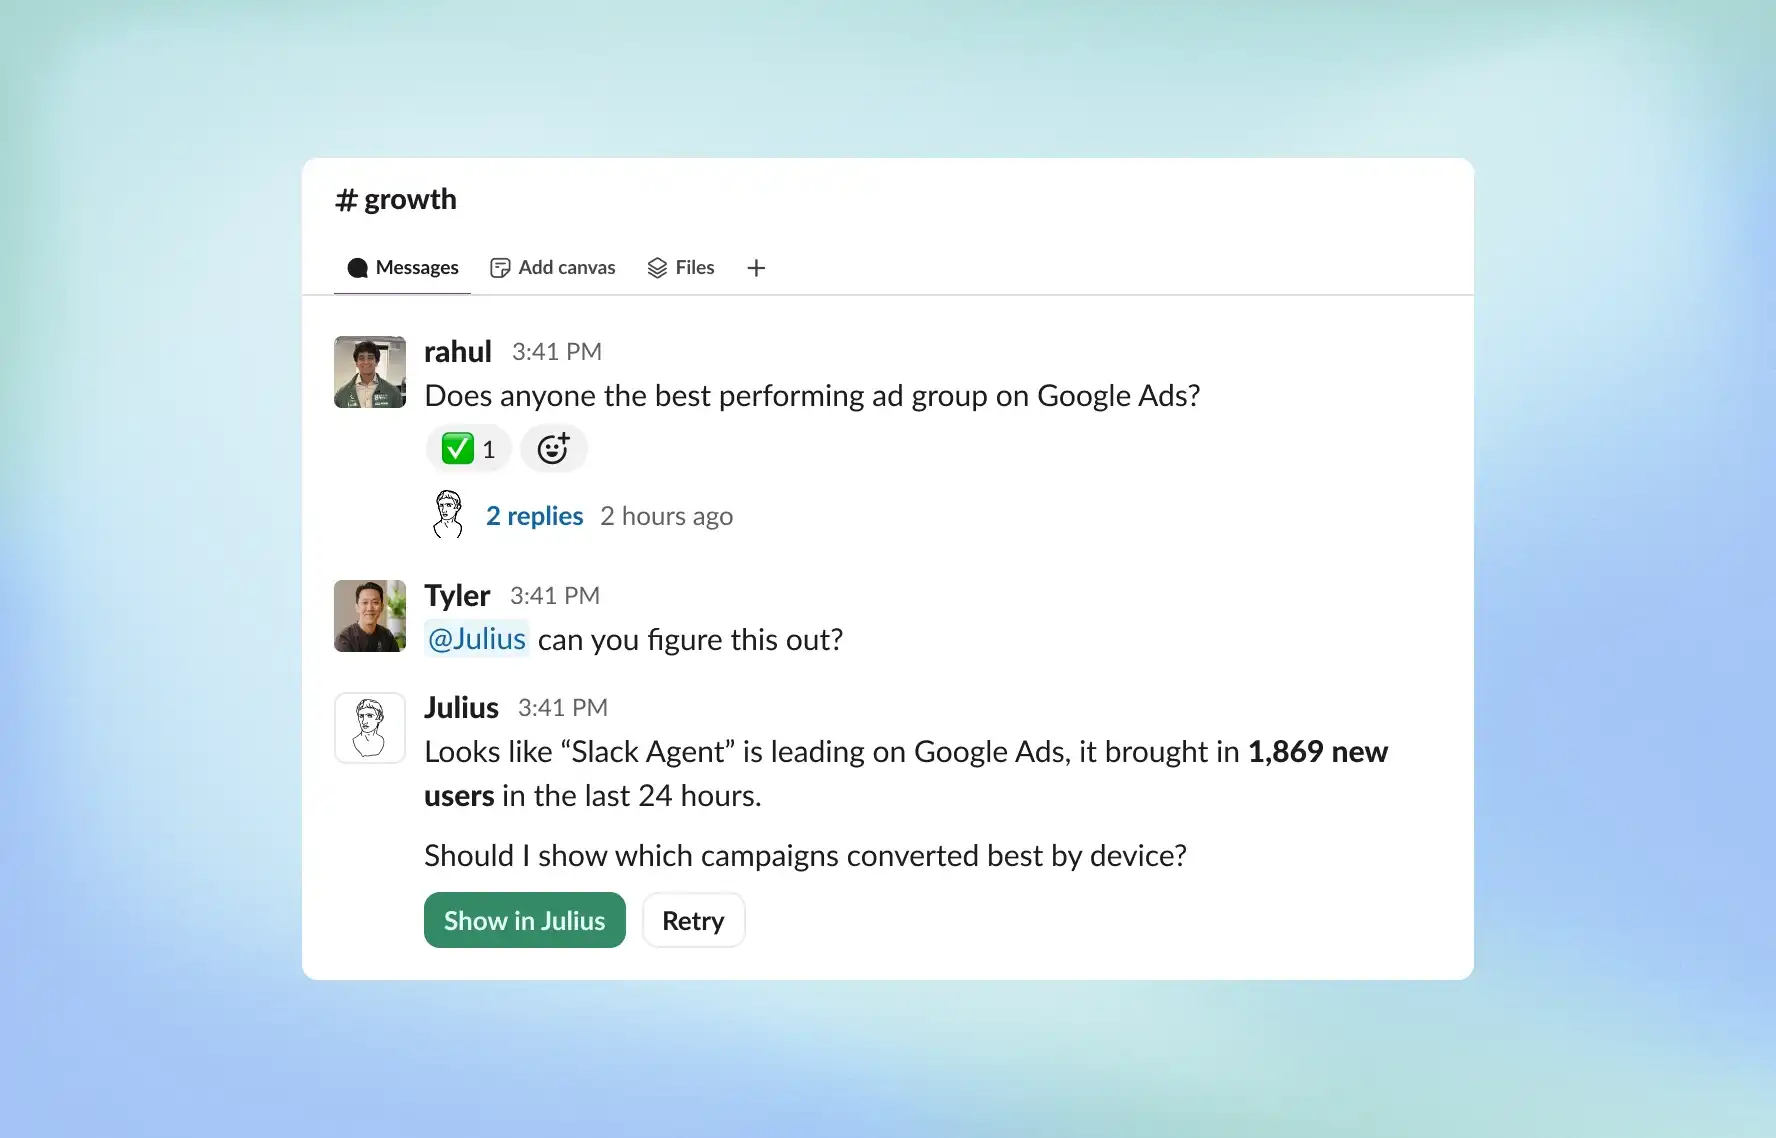
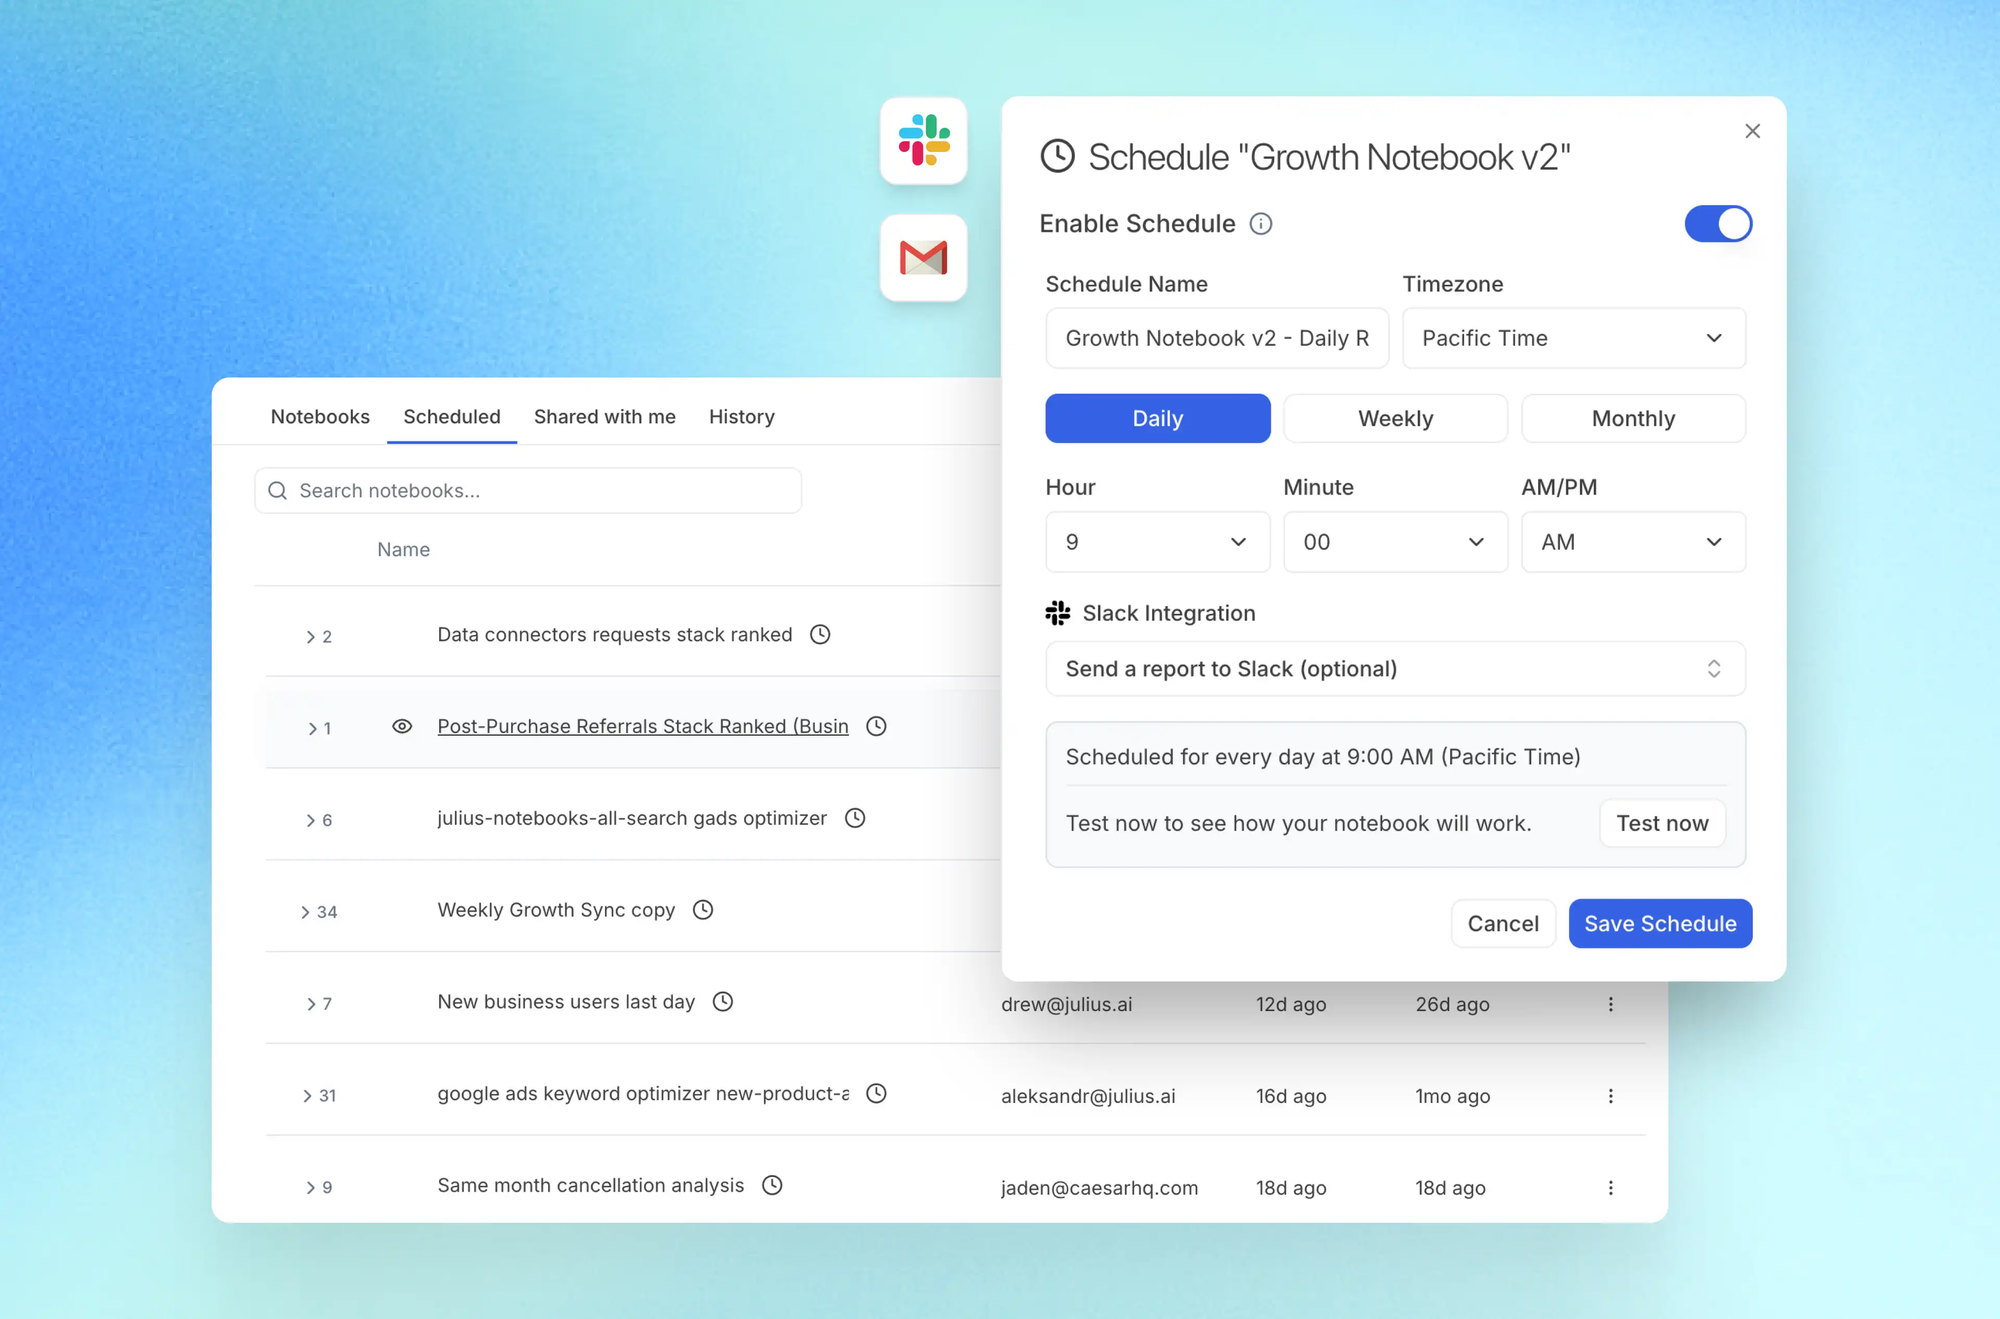
The Slack integration allows teams to ask questions and generate reports directly in their communication platform. Tag @Julius, ask your question, and get insights without switching contexts. Scheduled reports can be delivered automatically via Slack or email, keeping stakeholders updated without manual effort.
For users who want more control, Julius supports switching to R, Python, or SQL for reproducible analysis. This hybrid approach means non-coders can work conversationally while technical team members can review or extend the underlying code.
Data security meets enterprise requirements. Julius is compliant with SOC 2 Type II, TX-RAMP, and GDPR. Your data stays private and is never used to train AI models, addressing a common concern with AI tools.
Pricing includes a free basic plan with paid plans starting around $20 per month for more advanced features and higher usage limits. Enterprise pricing is available for larger organizations.
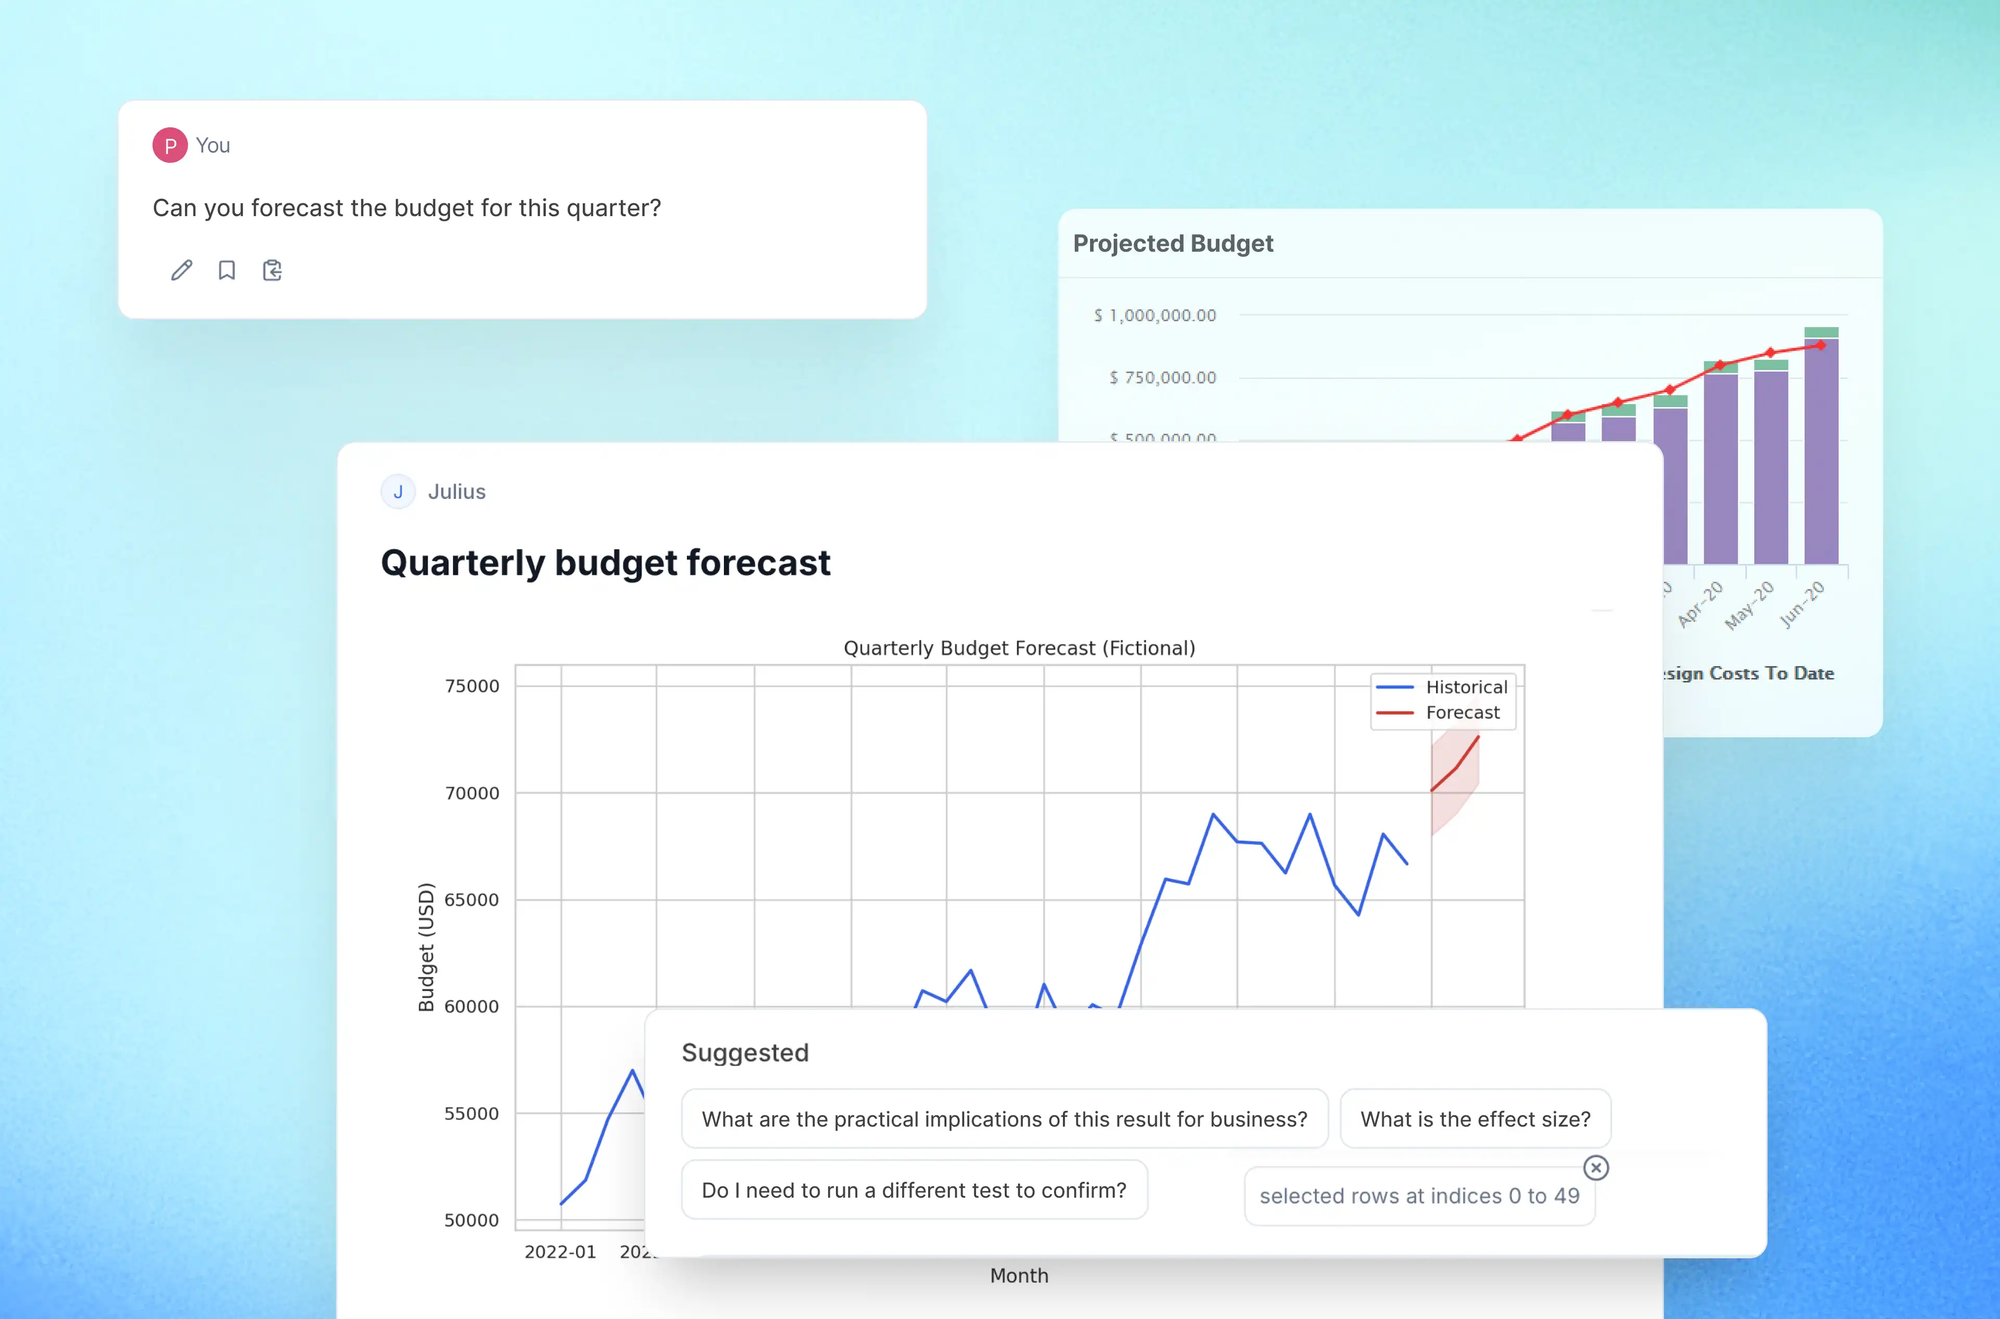
Julius works best for business users who need fast insights from structured data without coding. If your work involves regular analysis of sales data, customer metrics, marketing performance, or financial reports, Julius handles these use cases particularly well.
Microsoft Power BI with Copilot
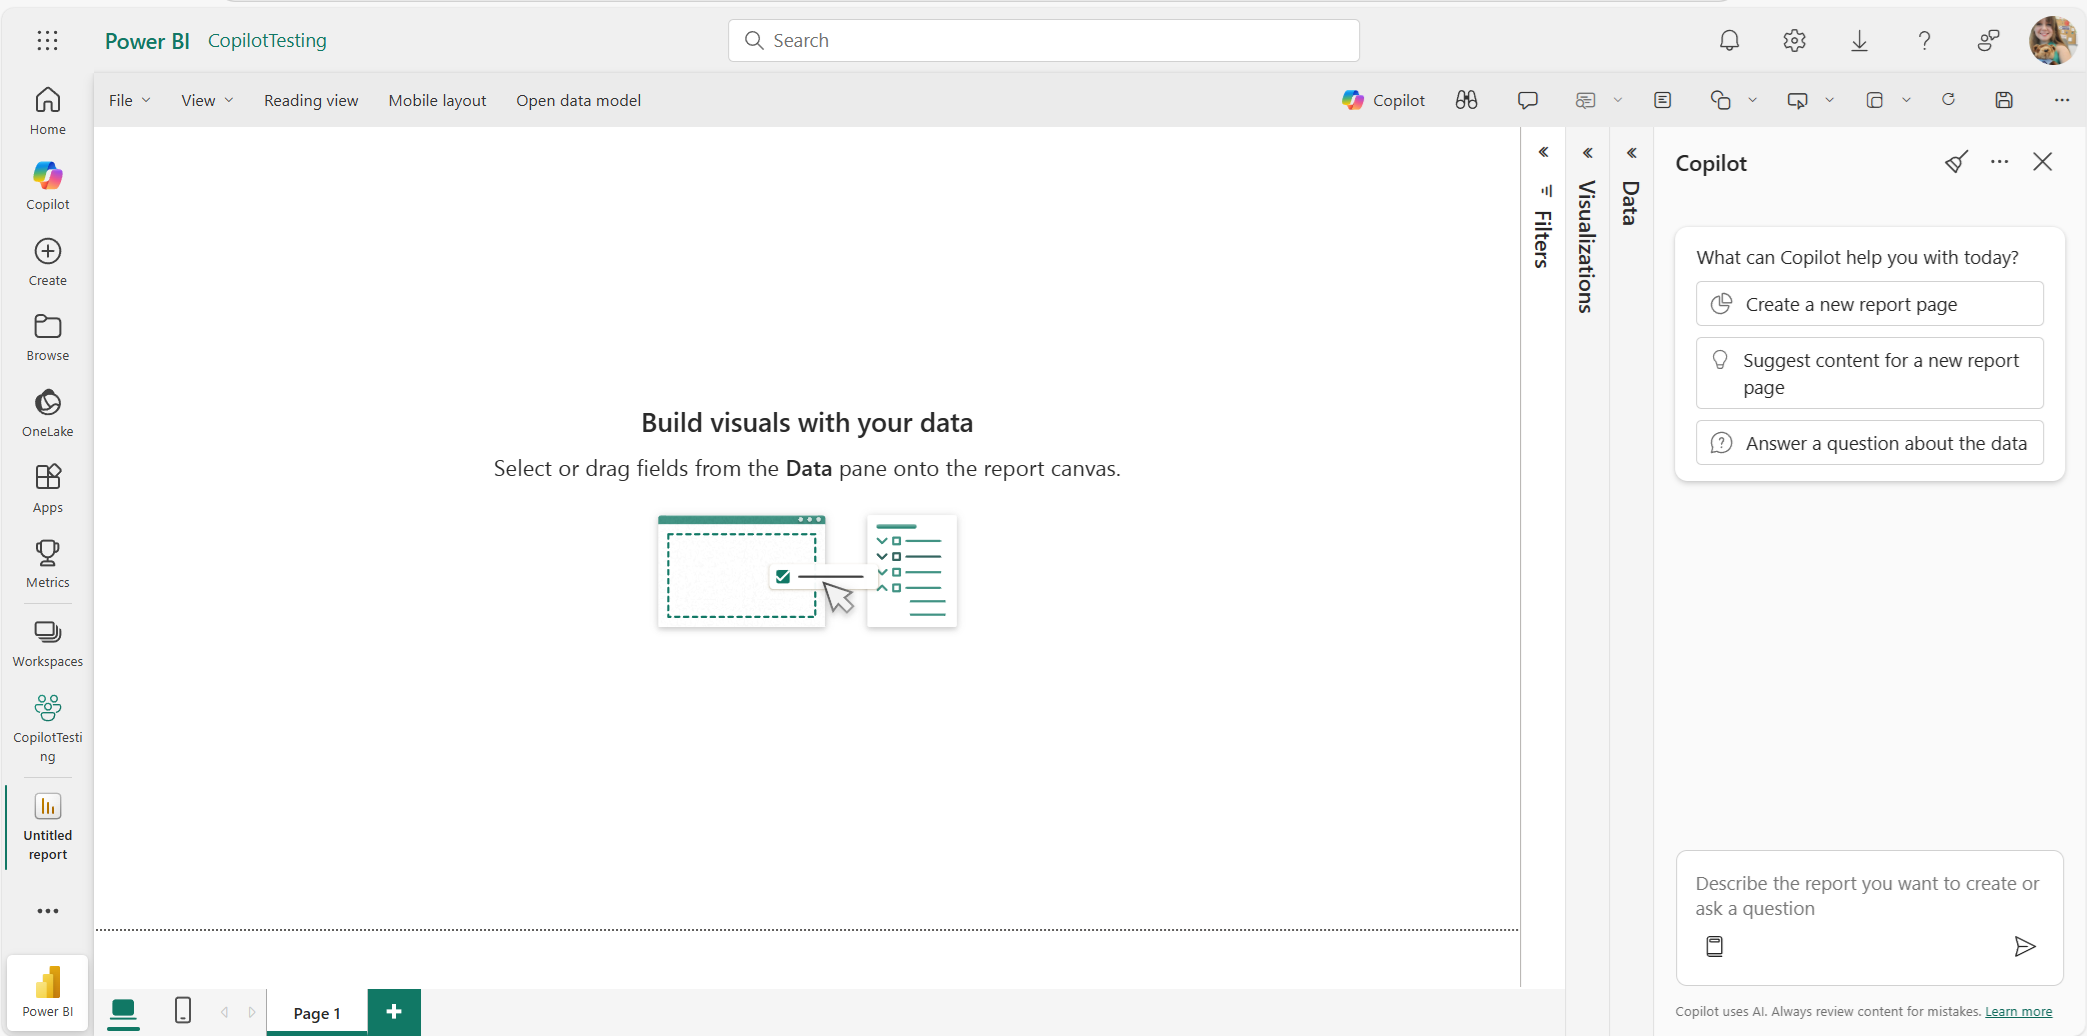
For organizations already invested in Microsoft's ecosystem, Power BI with Copilot integration offers AI-powered analysis that connects seamlessly to existing tools.
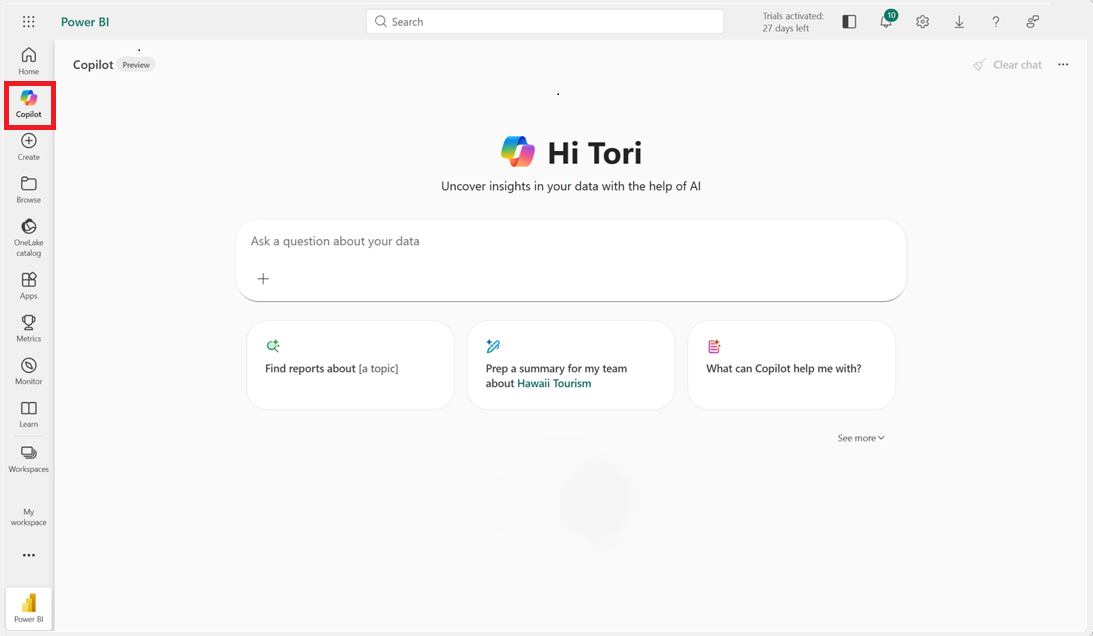
Power BI has long been a leading business intelligence platform with strong visualization capabilities and broad data connectivity. The addition of Copilot brings natural language interaction to these existing strengths.
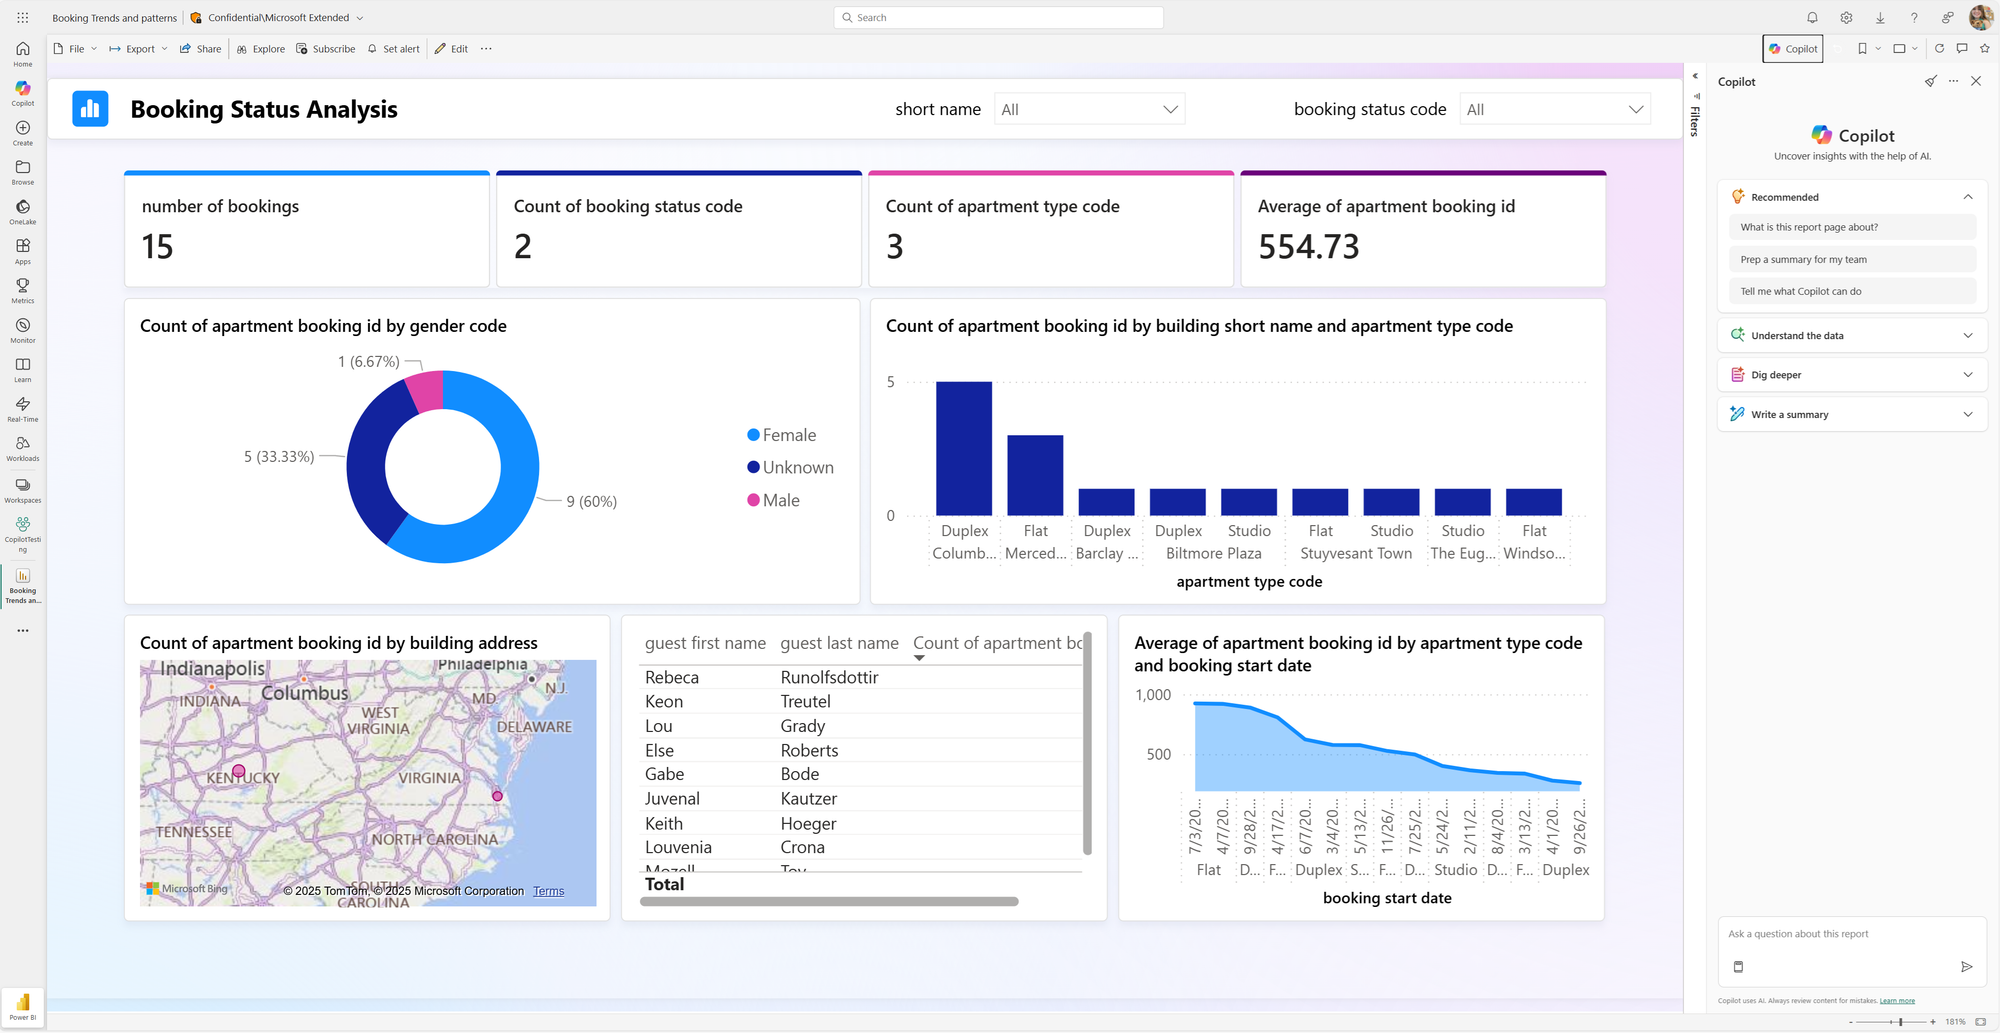
You can ask questions about your data in plain English and receive visualizations as answers. The AI understands context from your existing reports and dashboards, making it easier to explore data without building new visualizations from scratch.
The Microsoft integration is the primary advantage. Power BI connects natively to Excel files, SQL databases, SharePoint lists, Teams, Dynamics, Azure services, and dozens of other data sources. If your organization's data lives in Microsoft products, Power BI can access it without complex configuration.
Scheduled refreshes keep dashboards current without manual intervention. You can set reports to update daily, hourly, or at custom intervals, ensuring stakeholders always see recent data.
The learning curve is steeper than conversational tools like ChatGPT or Julius. Power BI's DAX formula language for custom calculations takes time to learn, though the AI assistance reduces how much you need to know. Once you understand the basics, you can create metrics like year-over-year growth and rolling averages that update automatically.
Pricing starts at $14 per user per month for Pro licenses. A free version works for individual reports but lacks collaboration features. Premium capacities for larger organizations have different pricing structures.
Power BI works best when your data already lives in the Microsoft ecosystem and you want scheduled report updates with enterprise-grade security. For users primarily working with standalone spreadsheets or needing quick ad-hoc analysis, the conversational tools offer a faster path to insights.
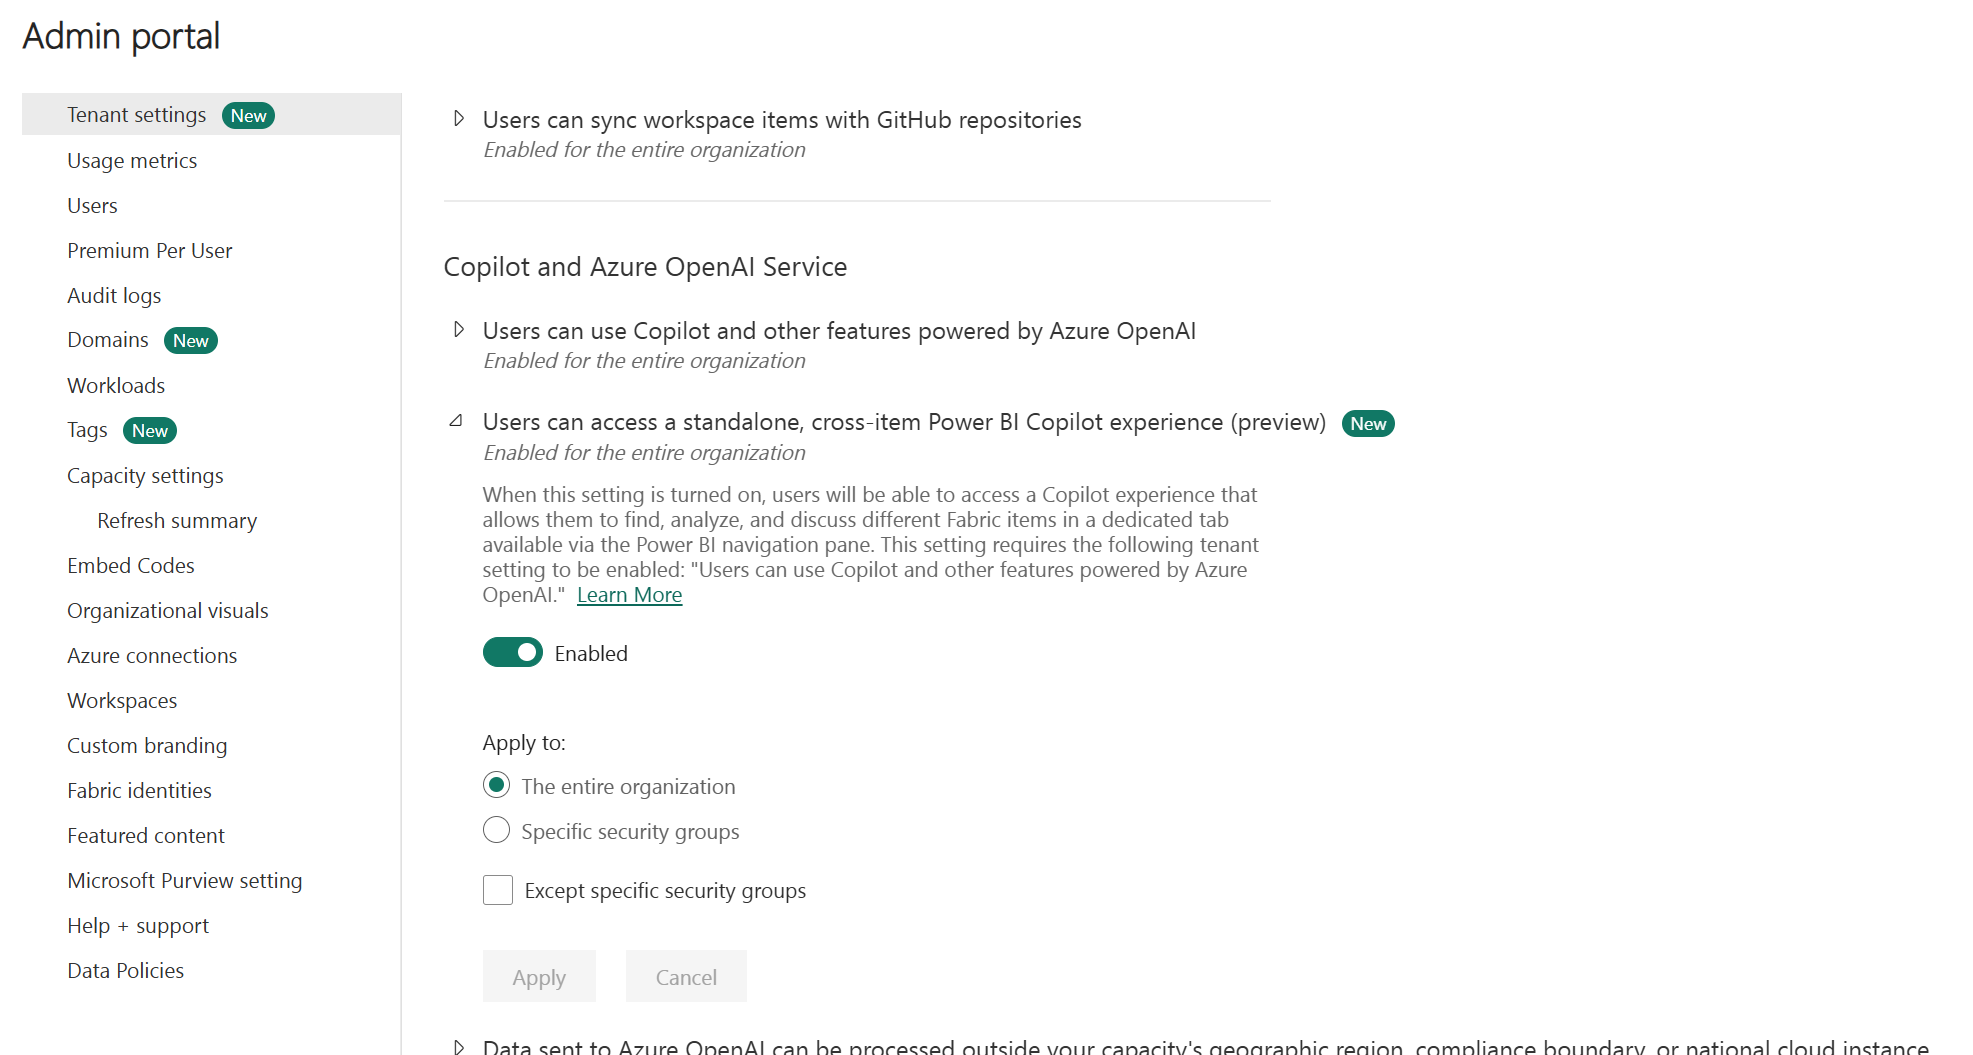
Tableau with AI Features
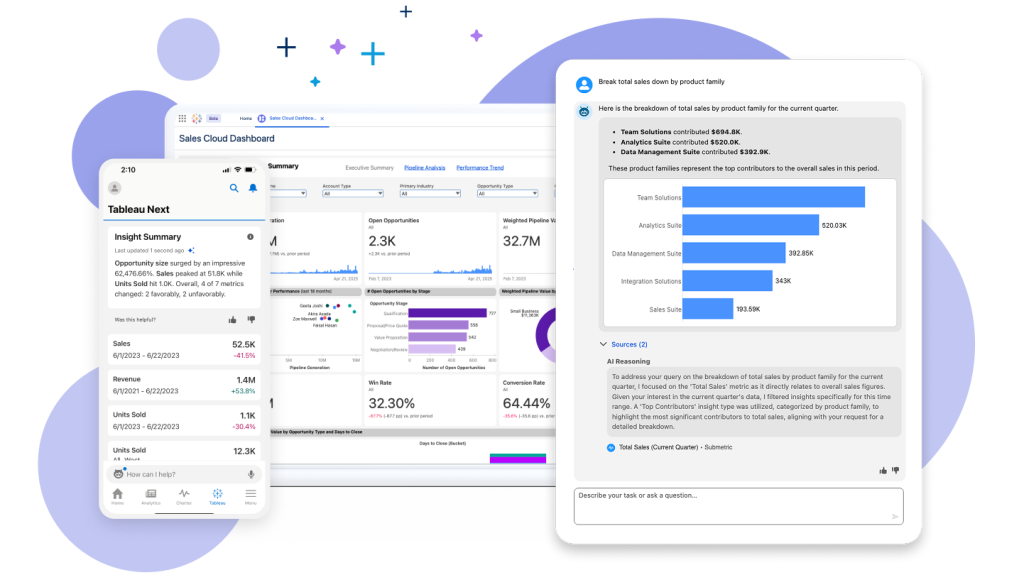
Tableau has been the gold standard for data visualization for years, and its AI features have made it significantly more accessible to non-technical users.
The "Ask Data" feature allows you to type questions in natural language and receive visualizations as answers. Instead of dragging fields into the right positions, you can ask "show me sales by region for the last quarter" and get a chart immediately.
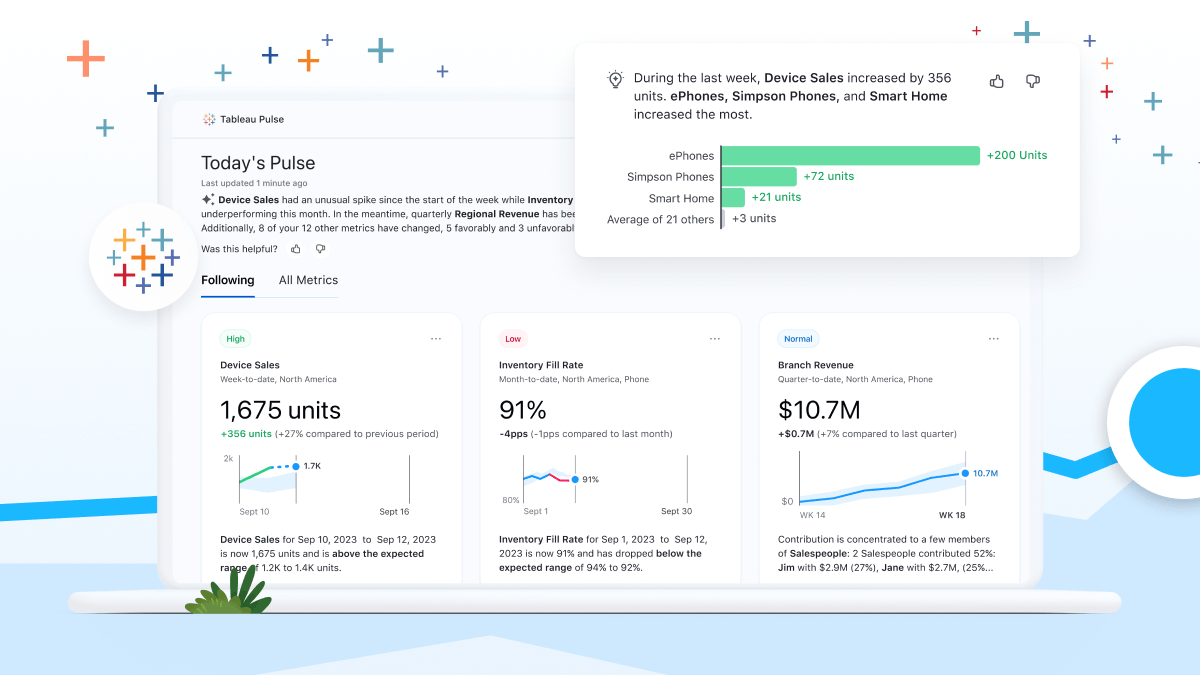
"Explain Data" is particularly powerful for understanding anomalies. When you notice something unexpected in your data, like a sudden drop in a metric, you can ask Tableau to explain it. The AI analyzes all possible factors and identifies what correlates with the anomaly, providing instant insight into the "why" behind data patterns.
Tableau's visualization capabilities remain best-in-class. The drag-and-drop interface allows for extensive customization when you want it, while AI assistance provides quick answers when you don't. This flexibility makes Tableau useful for both quick exploration and polished presentation-ready dashboards.
Real-time analytics connect to live data sources, so dashboards always reflect current information. This matters for operational dashboards that need up-to-the-minute accuracy.
The learning curve sits somewhere between Power BI and conversational tools. Tableau is more accessible than code-based analysis but still requires some investment to use effectively. The AI features lower this barrier but don't eliminate it entirely.
Pricing includes Creator, Explorer, and Viewer licenses starting around $75 per user per month. A free public version is available for non-commercial use.
Tableau makes sense when visualization quality matters most. If you need to create compelling, interactive dashboards for stakeholders, clients, or public audiences, Tableau's design capabilities justify the higher price and learning investment.
Powerdrill Bloom
Powerdrill Bloom represents a newer category of AI data tools focused specifically on turning raw data into visual presentations.
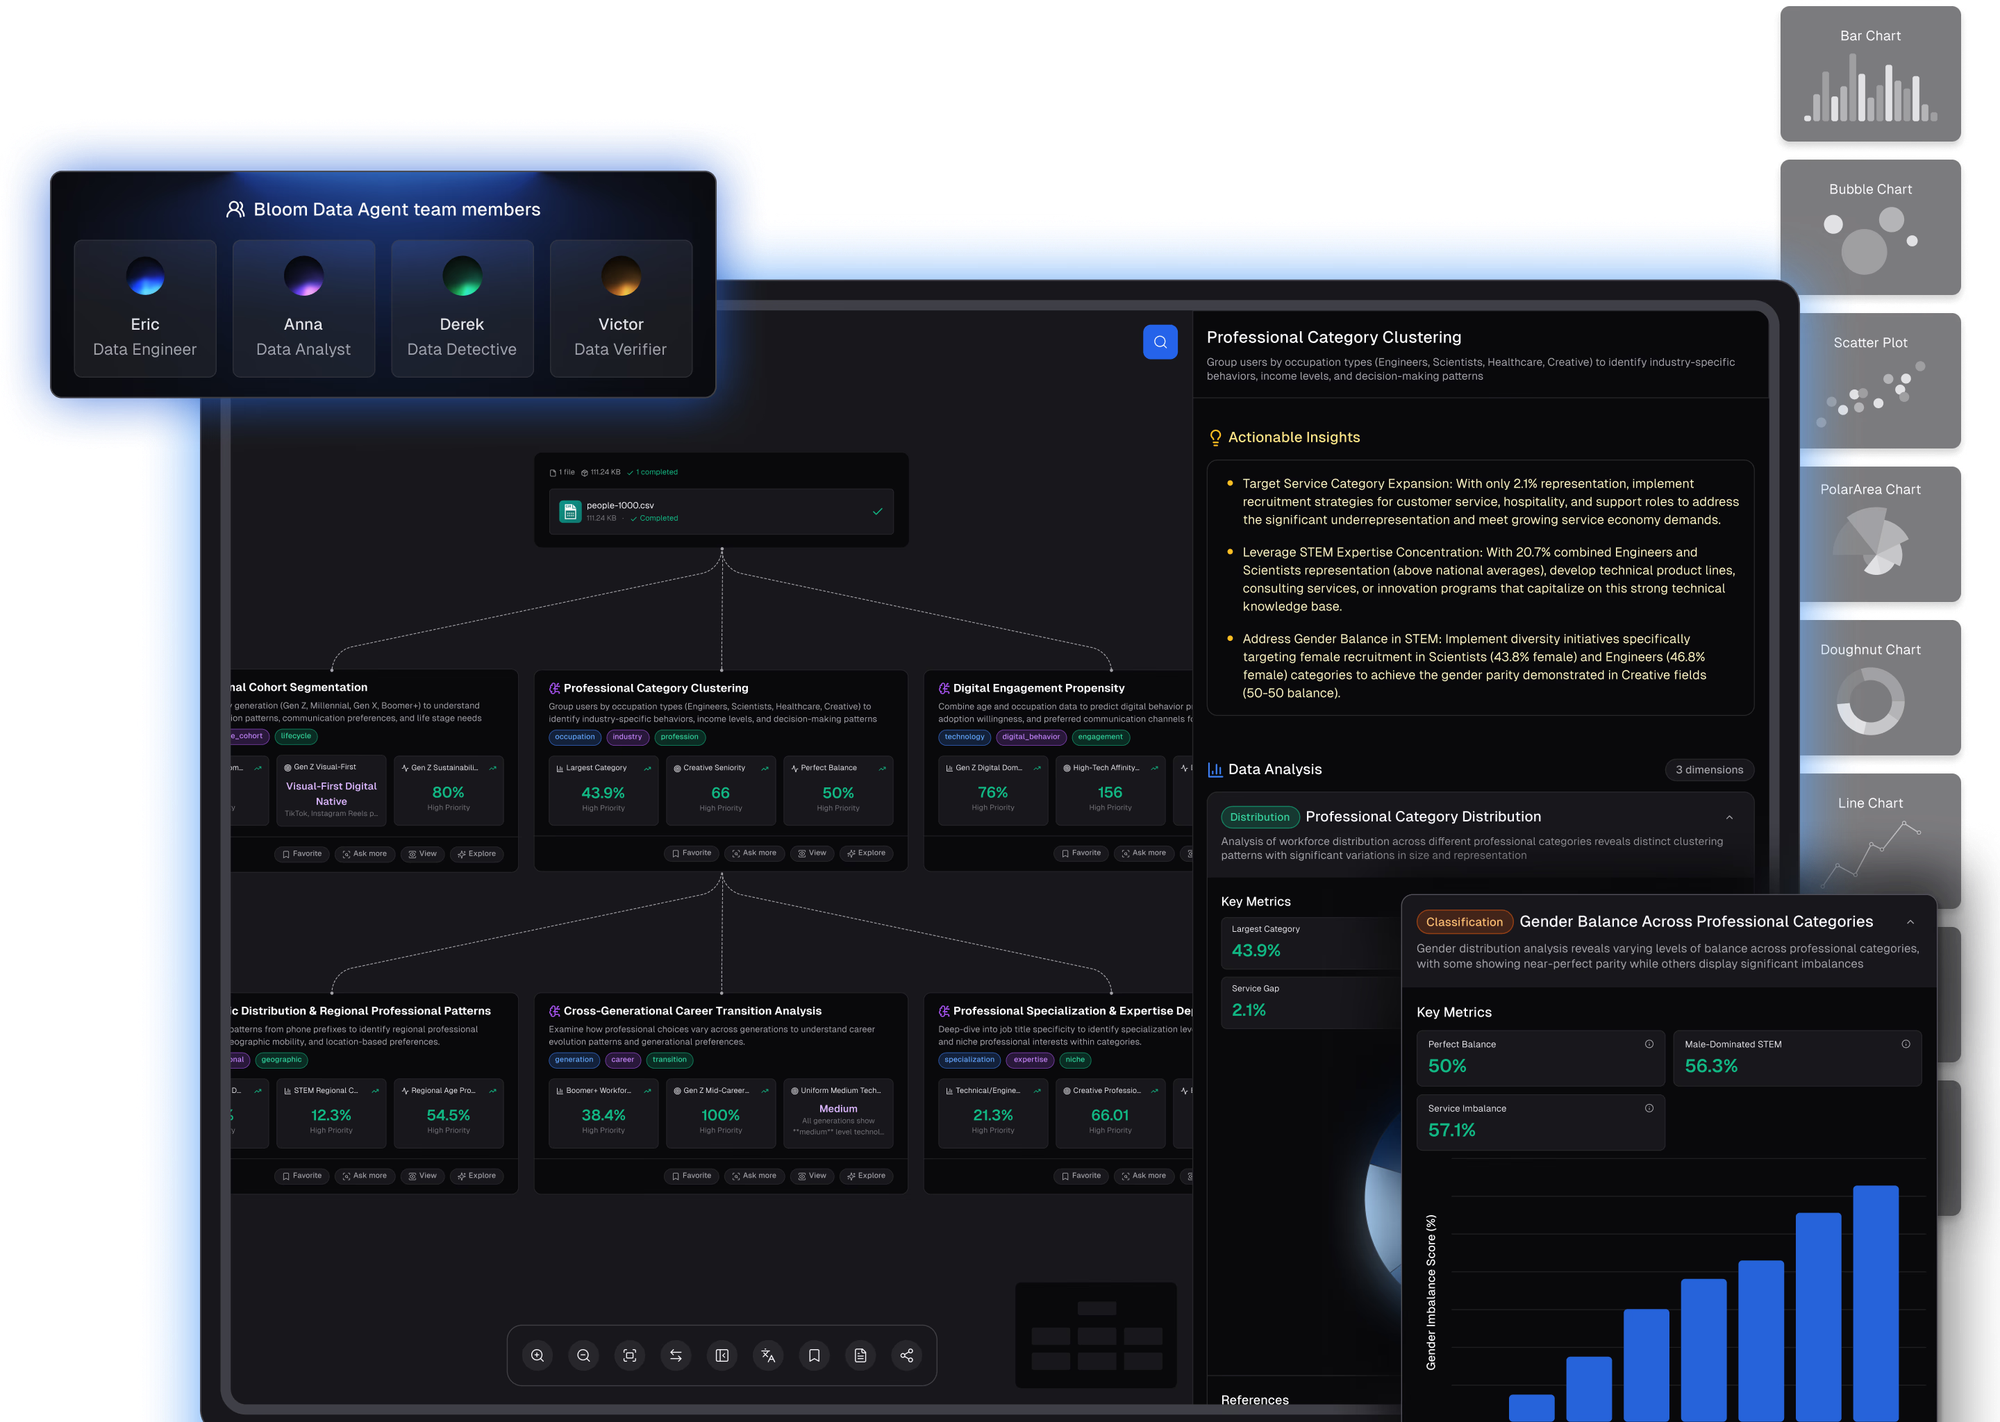
The platform handles Excel, CSV, and PDF files with strong auto-cleaning capabilities that deal with messy datasets. This addresses a common pain point: real-world data is rarely clean, and preparing it for analysis traditionally required significant manual work.
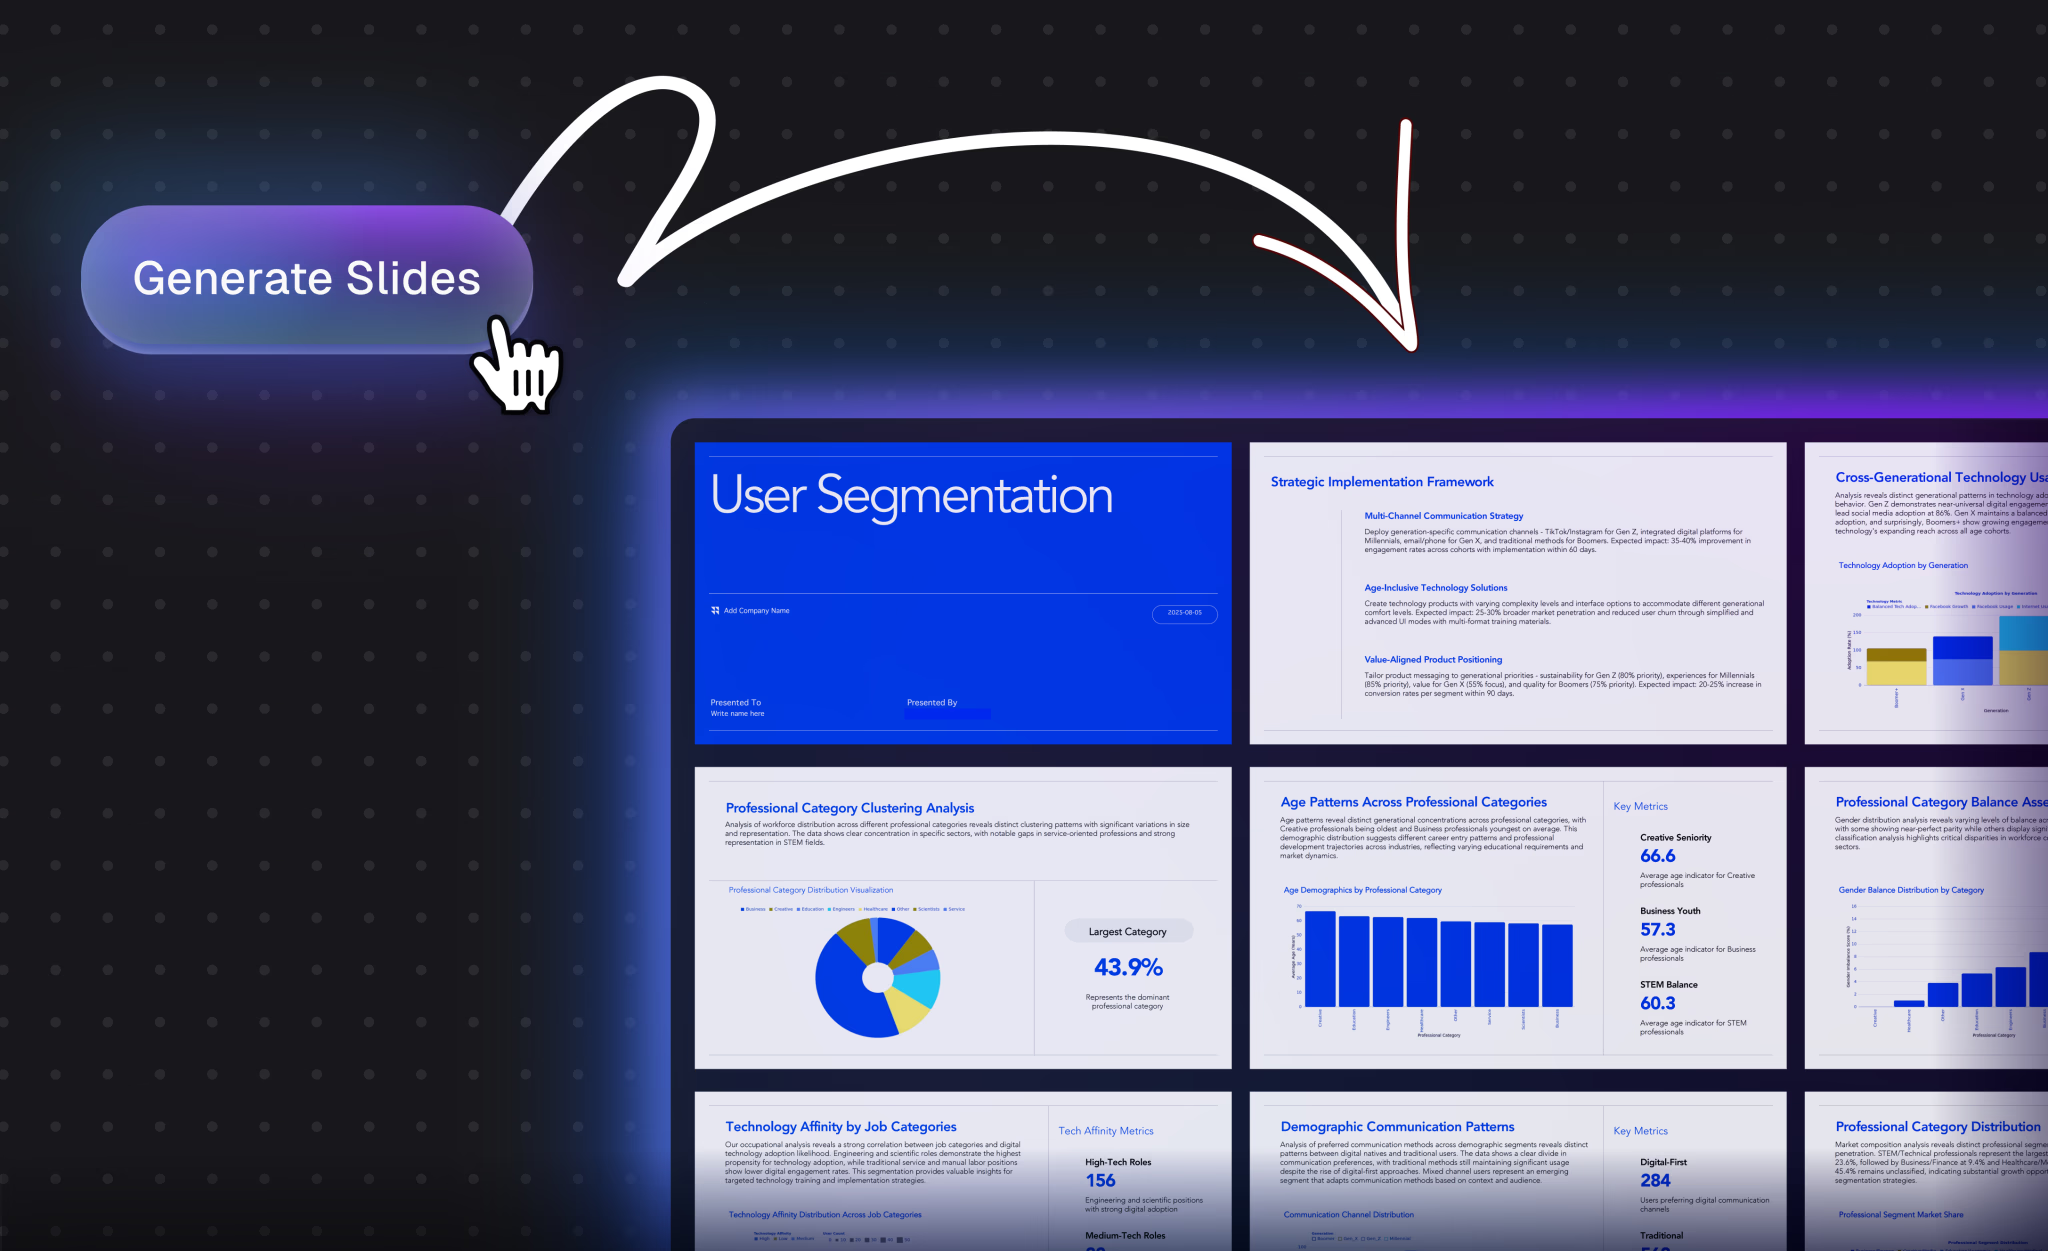
The standout feature is Nano Banana Pro, a visual engine that generates professional slides and data preview images in real time. Instead of analyzing data and then building a presentation separately, Powerdrill creates presentation-ready visualizations directly. This bridges the gap between "raw data" and "executive summary" that often takes hours to cross manually.
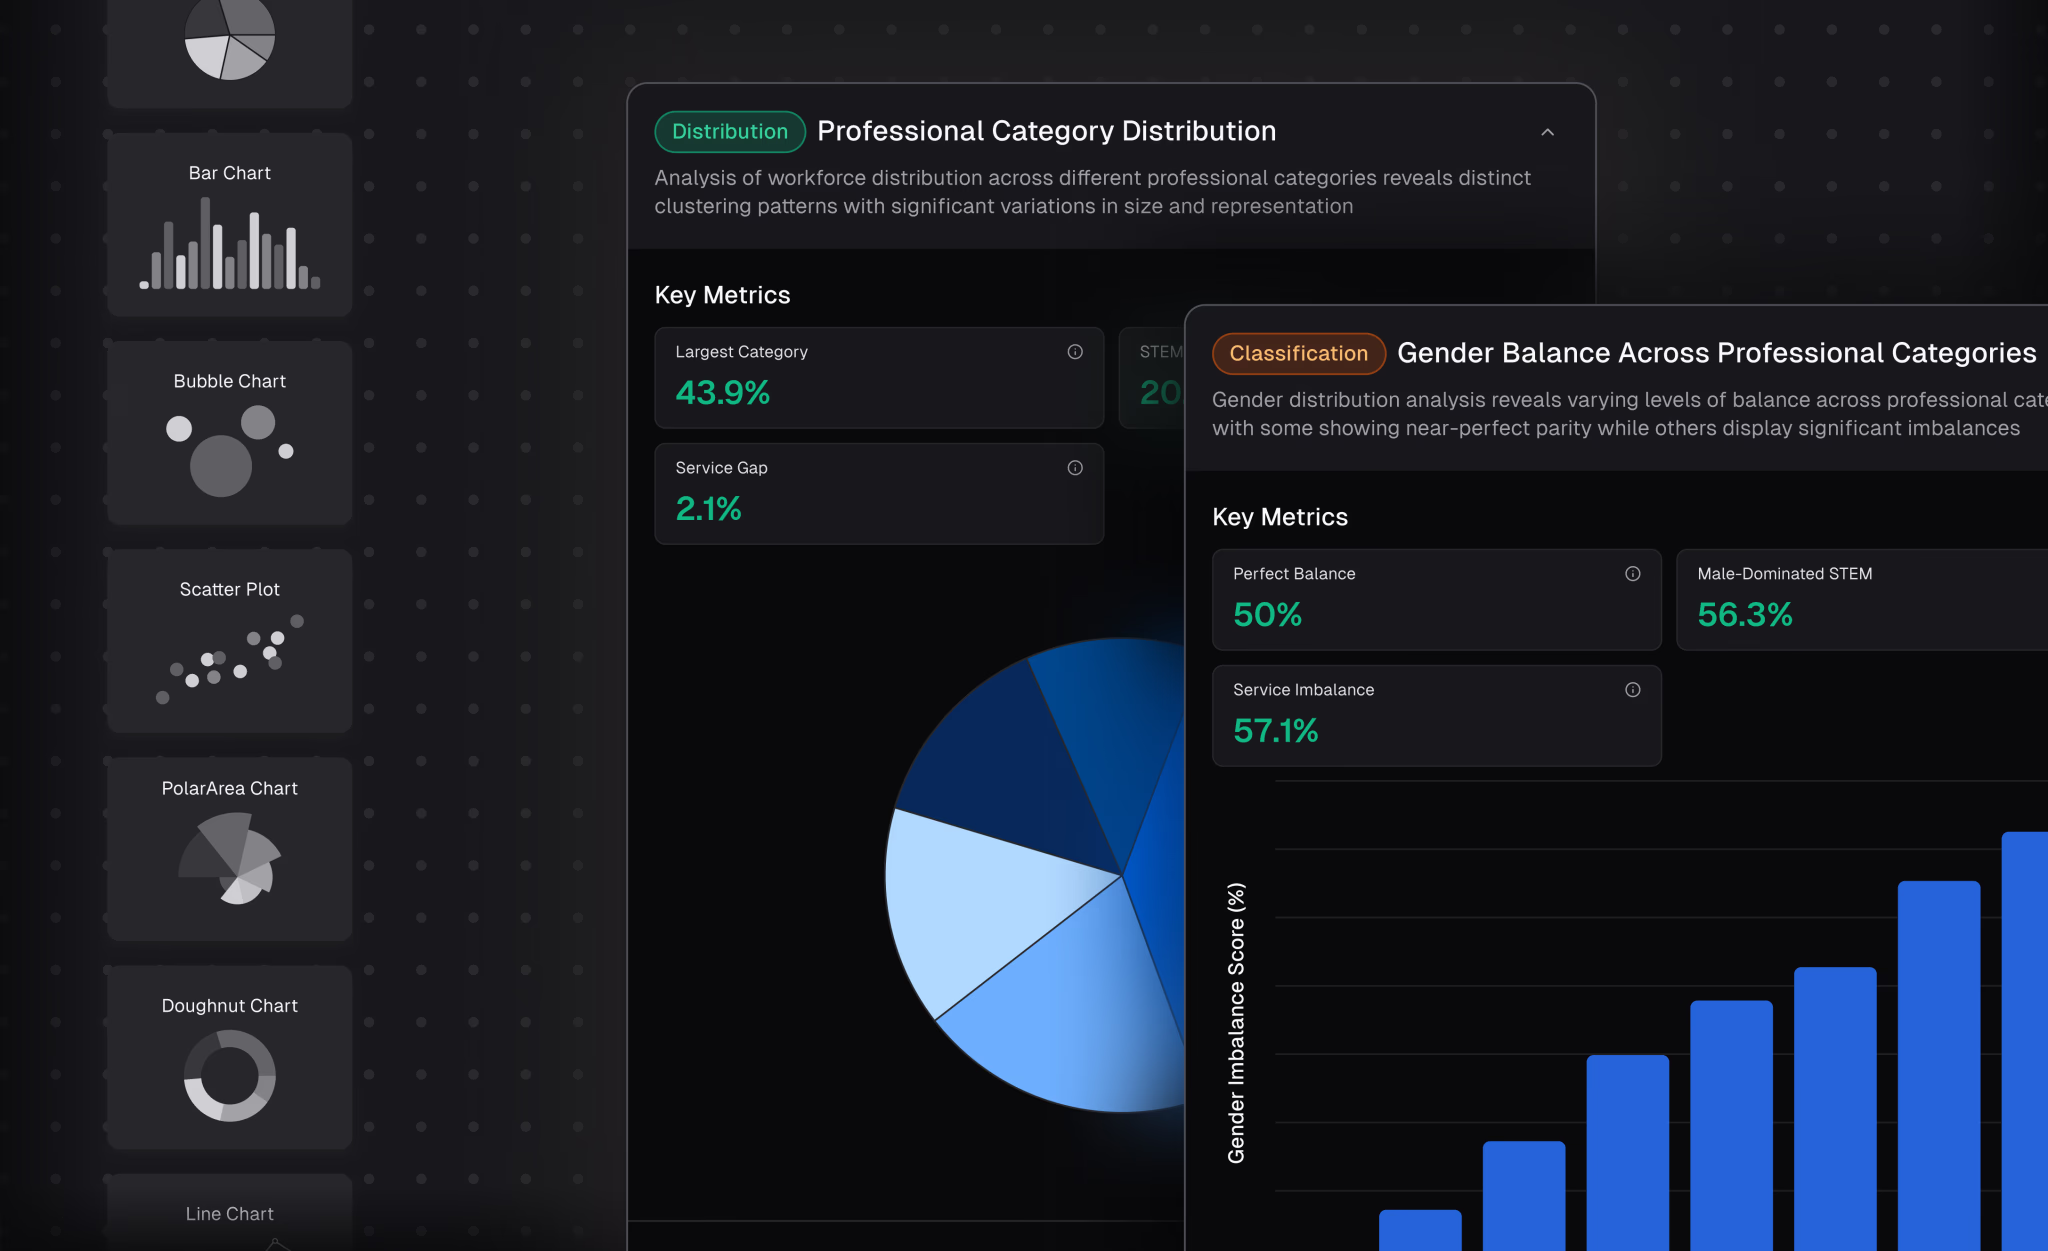
The analysis capabilities go beyond descriptive statistics to include trend prediction and complex analysis. The platform aims to answer not just "what happened" but "what will happen" based on patterns in your data.
For business professionals in marketing, sales, or operations who need to analyze data and then present findings, Powerdrill's integrated approach saves significant time. You're not using one tool to analyze and another to visualize.
Pricing includes a flexible free trial with Pro subscriptions available. The positioning is specifically toward business users rather than data scientists or developers.
Powerdrill works best when your goal is to get insights via natural conversation and generate high-impact presentation slides instantly. If you regularly turn data analysis into presentations for stakeholders, this integrated approach eliminates manual translation between tools.
Google Sheets with Gemini
For users who live in Google's ecosystem, Sheets with Gemini integration brings AI-powered analysis to a familiar interface.
The approach keeps you in the spreadsheet environment you already know while adding conversational AI capabilities. You can ask questions about your data, request visualizations, and get help with formulas without leaving Sheets.
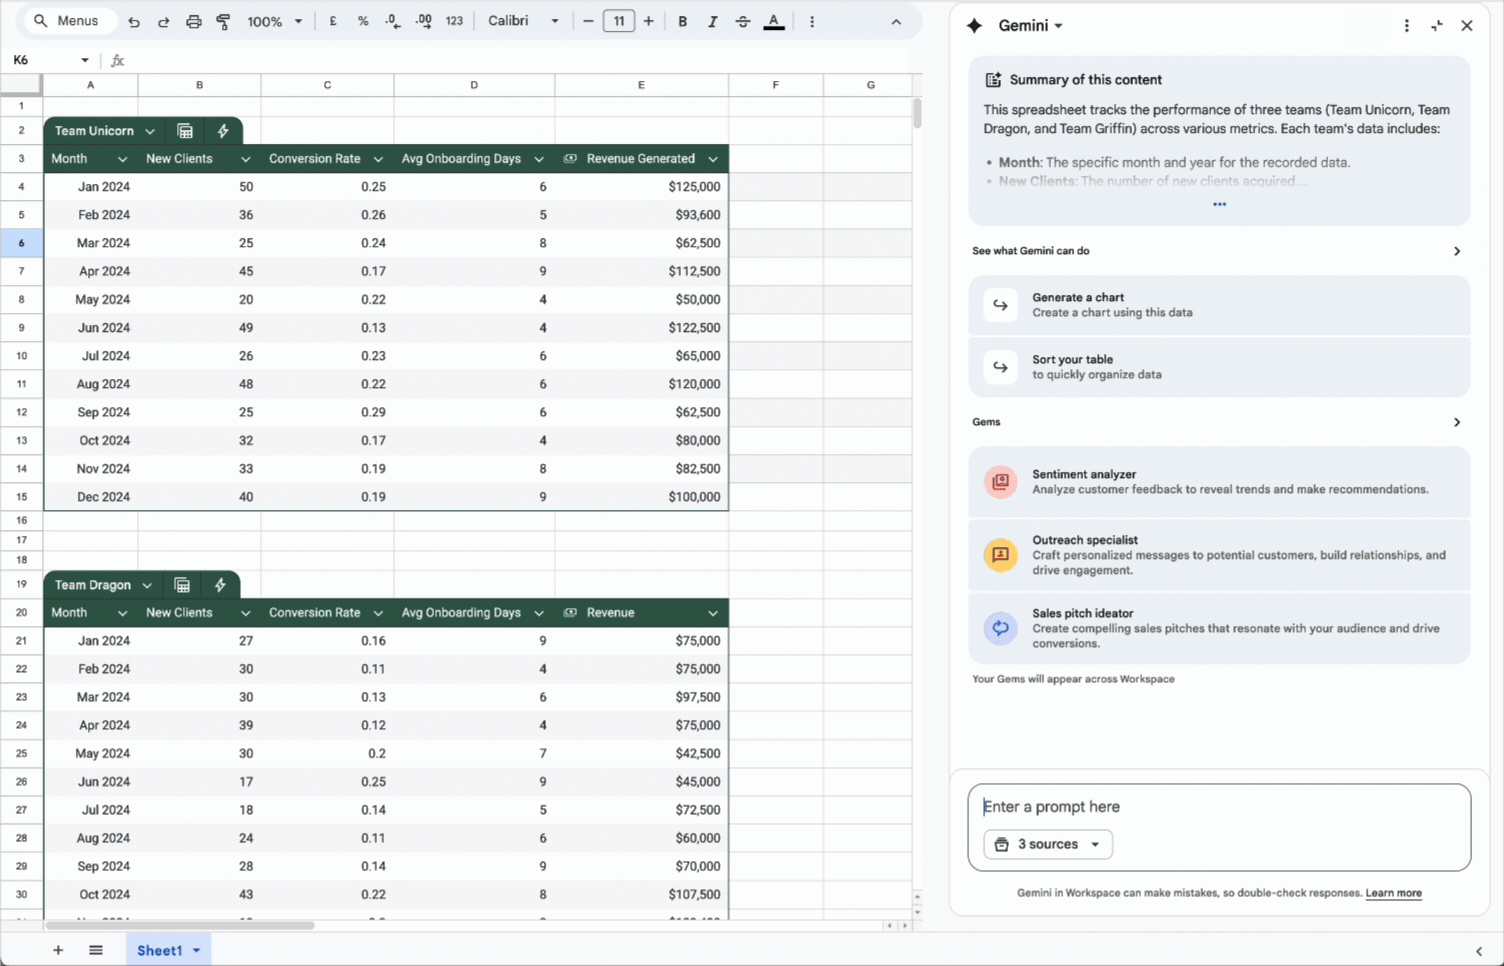
This familiarity is the main advantage. There's no new tool to learn, no data to export, and no context switching. If your data is already in Google Sheets, you can start asking questions immediately.
The integration with other Google Workspace tools means analysis can flow directly into Docs, Slides, and other applications. Creating a report that pulls data from Sheets, analyzes it with AI, and presents findings in Slides becomes a relatively seamless workflow.
| Action | Description |
|---|---|
| Insert | Insert generated text into your spreadsheet. |
| Insert image | Insert a generated image into your spreadsheet. |
| Copy | Copy a suggestion. |
| Retry | Generate a different response from Gemini. |
| Retry with Google Search | Search on Google for more information about your question or request. |
| View more | View more of the response from Gemini. |
| View less | Minimize the response from Gemini. |
| Good suggestion | Give positive feedback about a response from Gemini. |
| Bad suggestion | Report an issue with a response from Gemini. |
| Show code | Show code used to generate the output. |
| Hide code | Hide code used to generate the output. |
| Gem | To save time with repetitive tasks, chat with a Gem or create your own. |
| Undo | Reverse the last Gemini action. |
| Export to Docs | Export the response from Gemini to a new document in Google Docs. |
The analysis capabilities are more limited than dedicated tools like Julius or Tableau. Gemini in Sheets handles basic analysis, formula generation, and data cleanup well but struggles with complex statistical analysis or sophisticated visualizations.
Pricing is included with Google Workspace subscriptions that include Gemini features. Individual users can access basic capabilities through Google One AI Premium plans.
Google Sheets with Gemini works best for users who want AI assistance without changing their workflow. If your analysis needs are relatively straightforward and your data already lives in Google's ecosystem, this integration provides value without requiring new tools or processes.
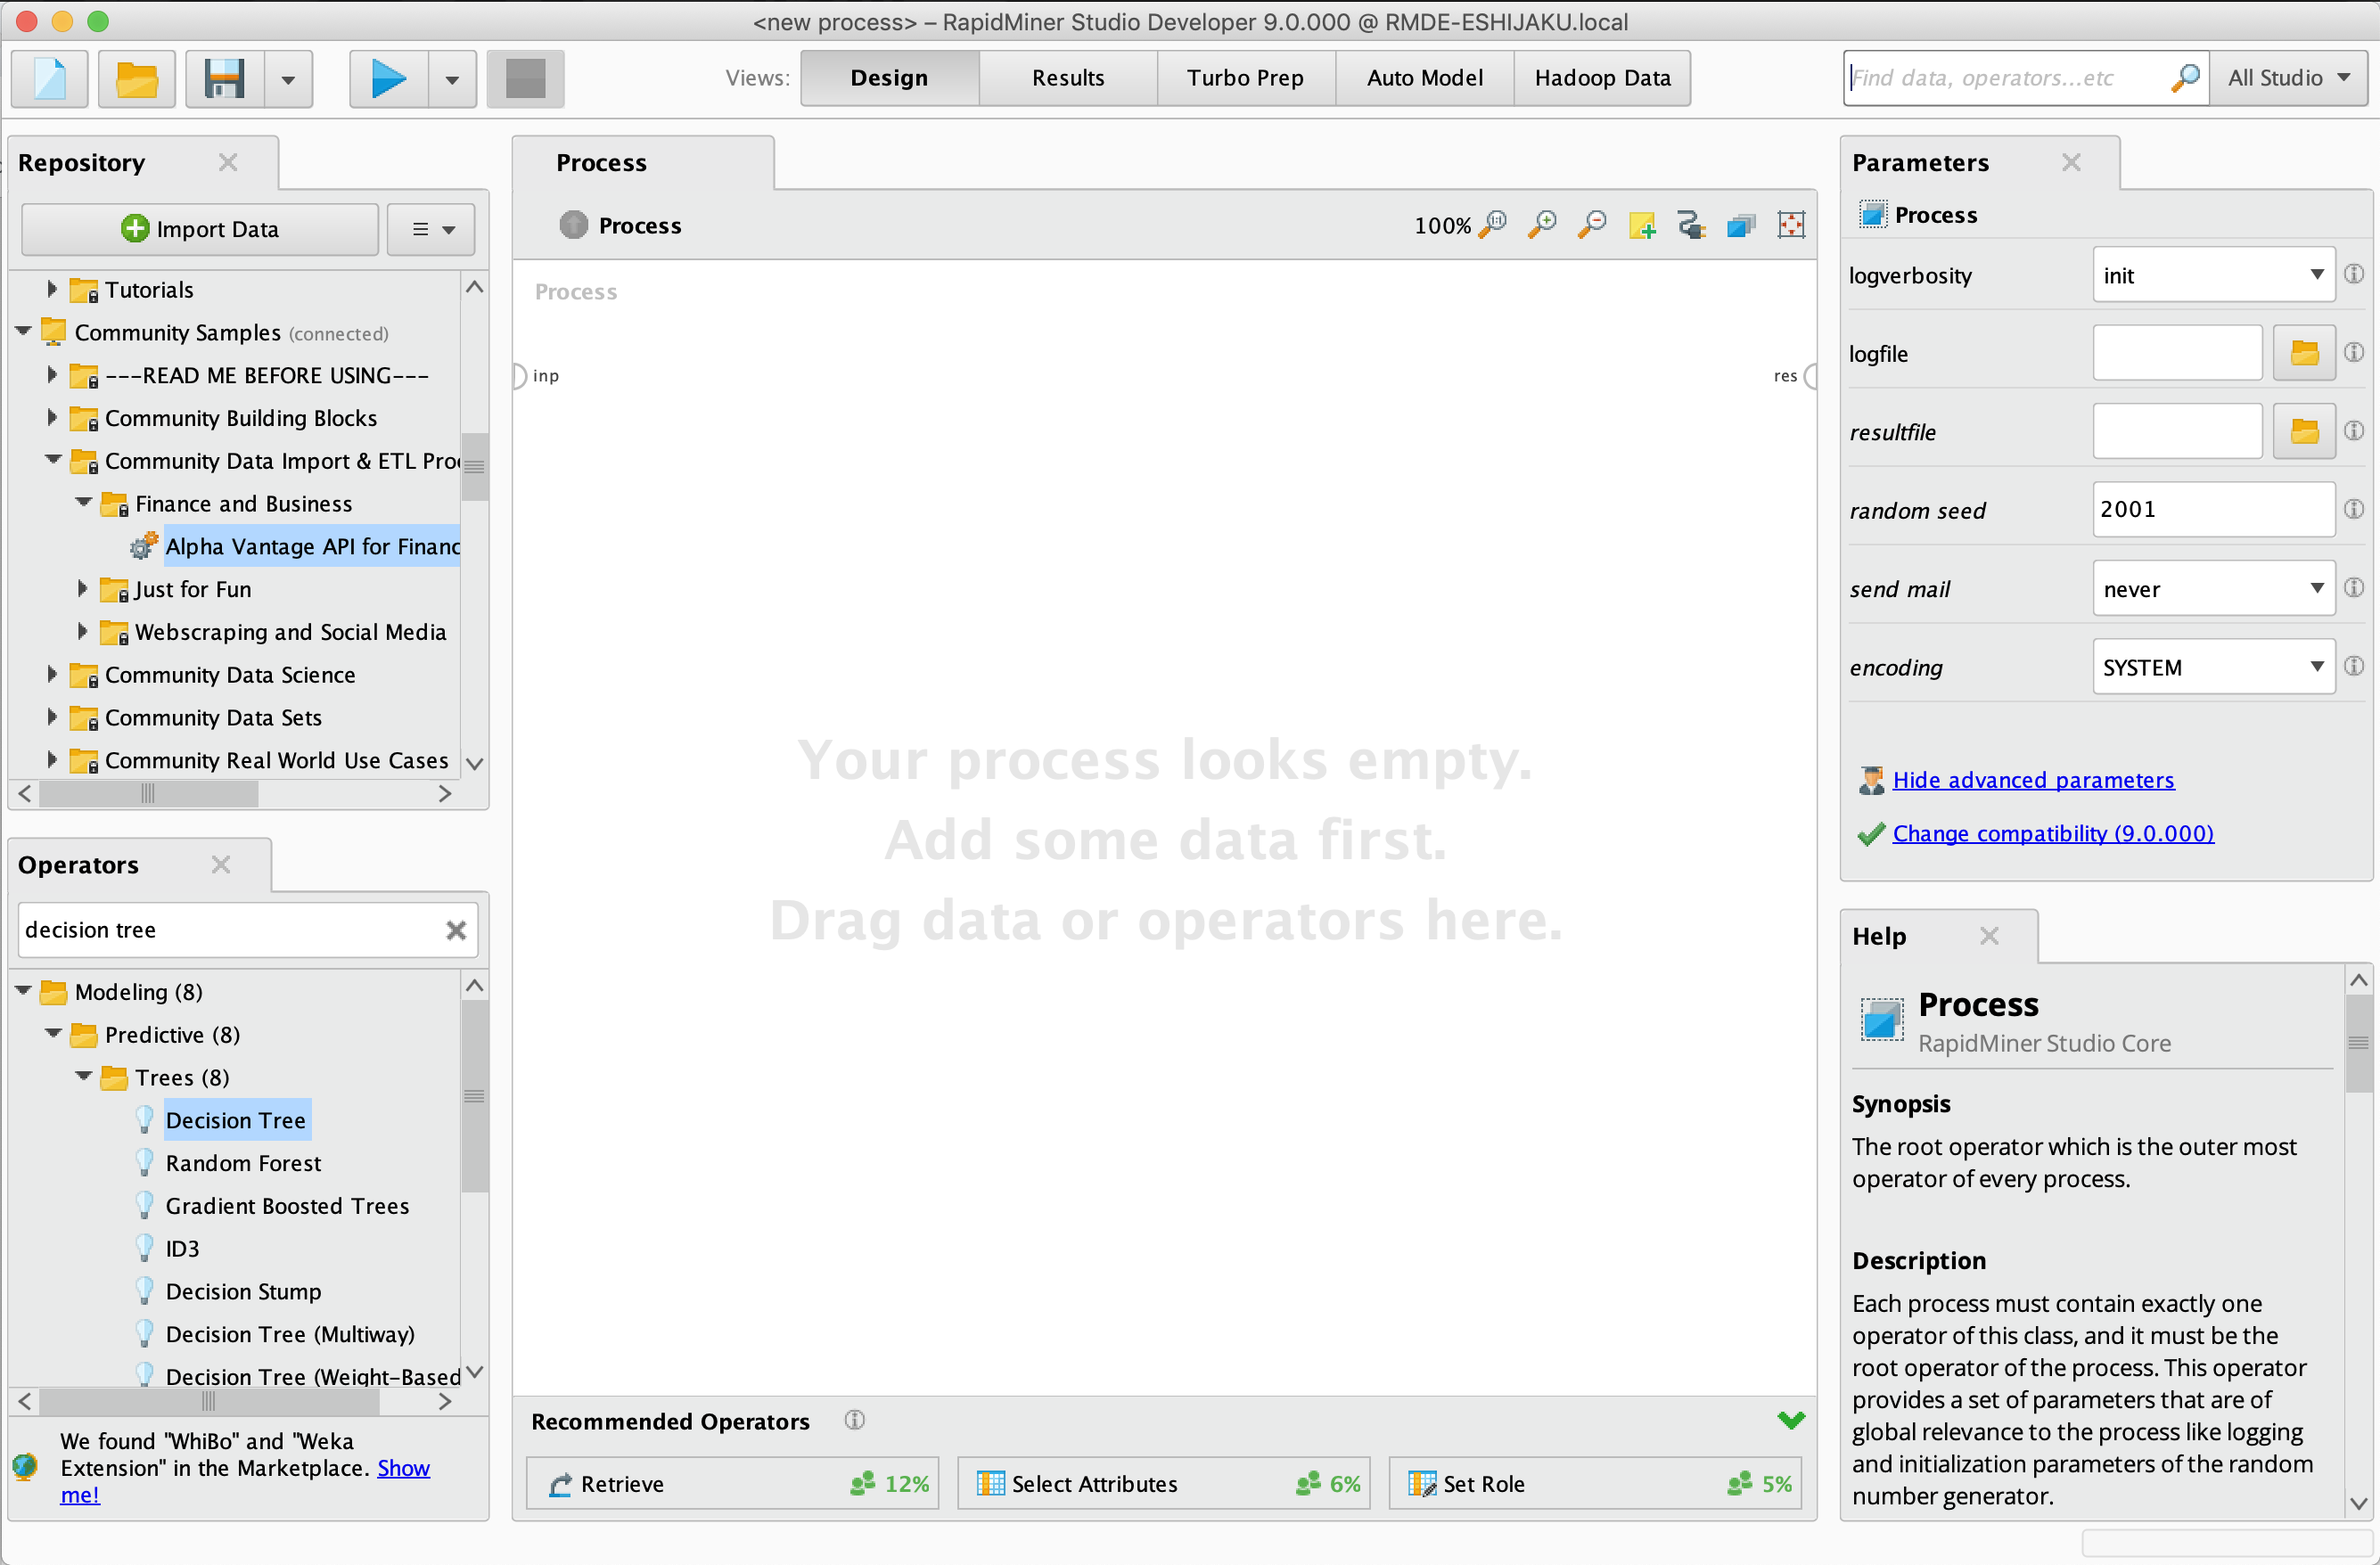
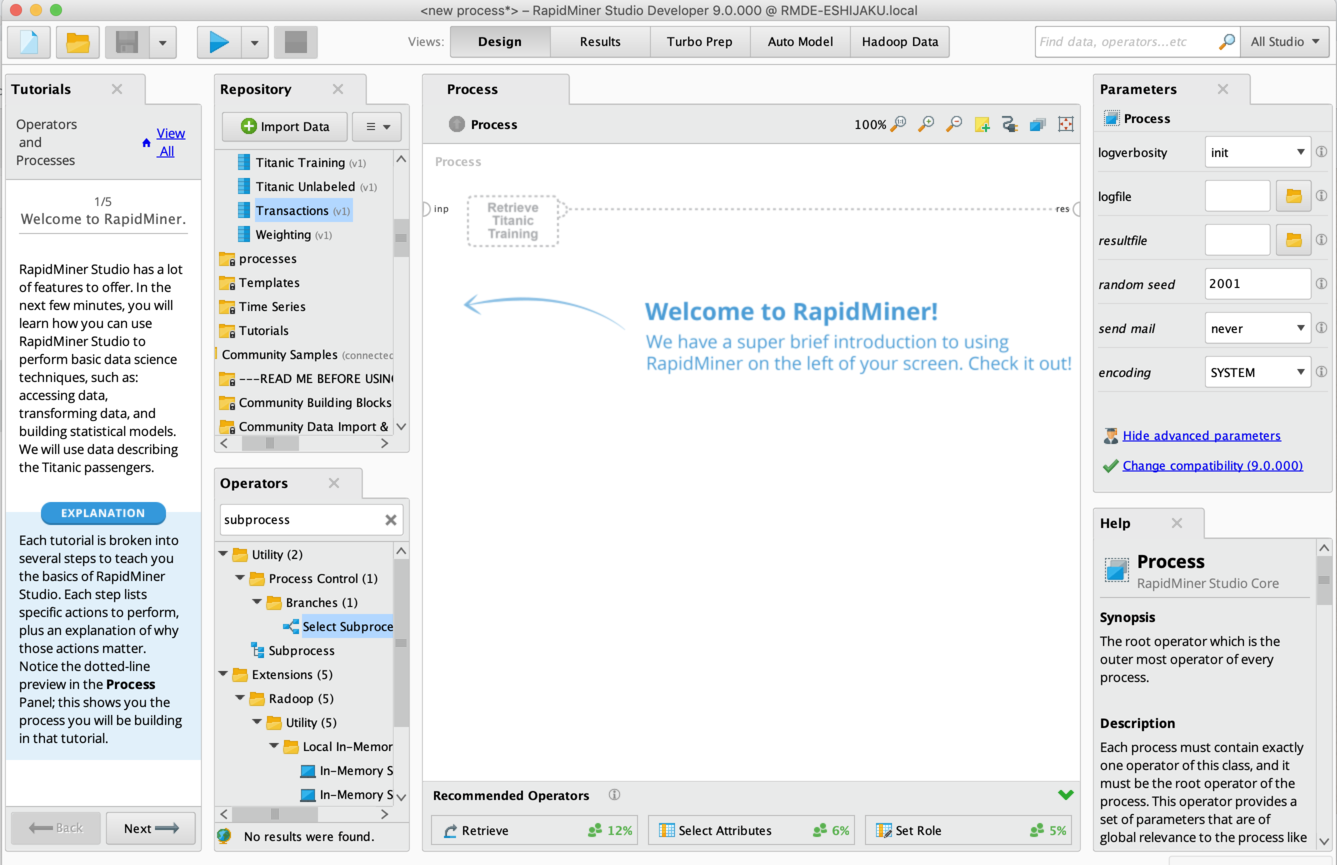
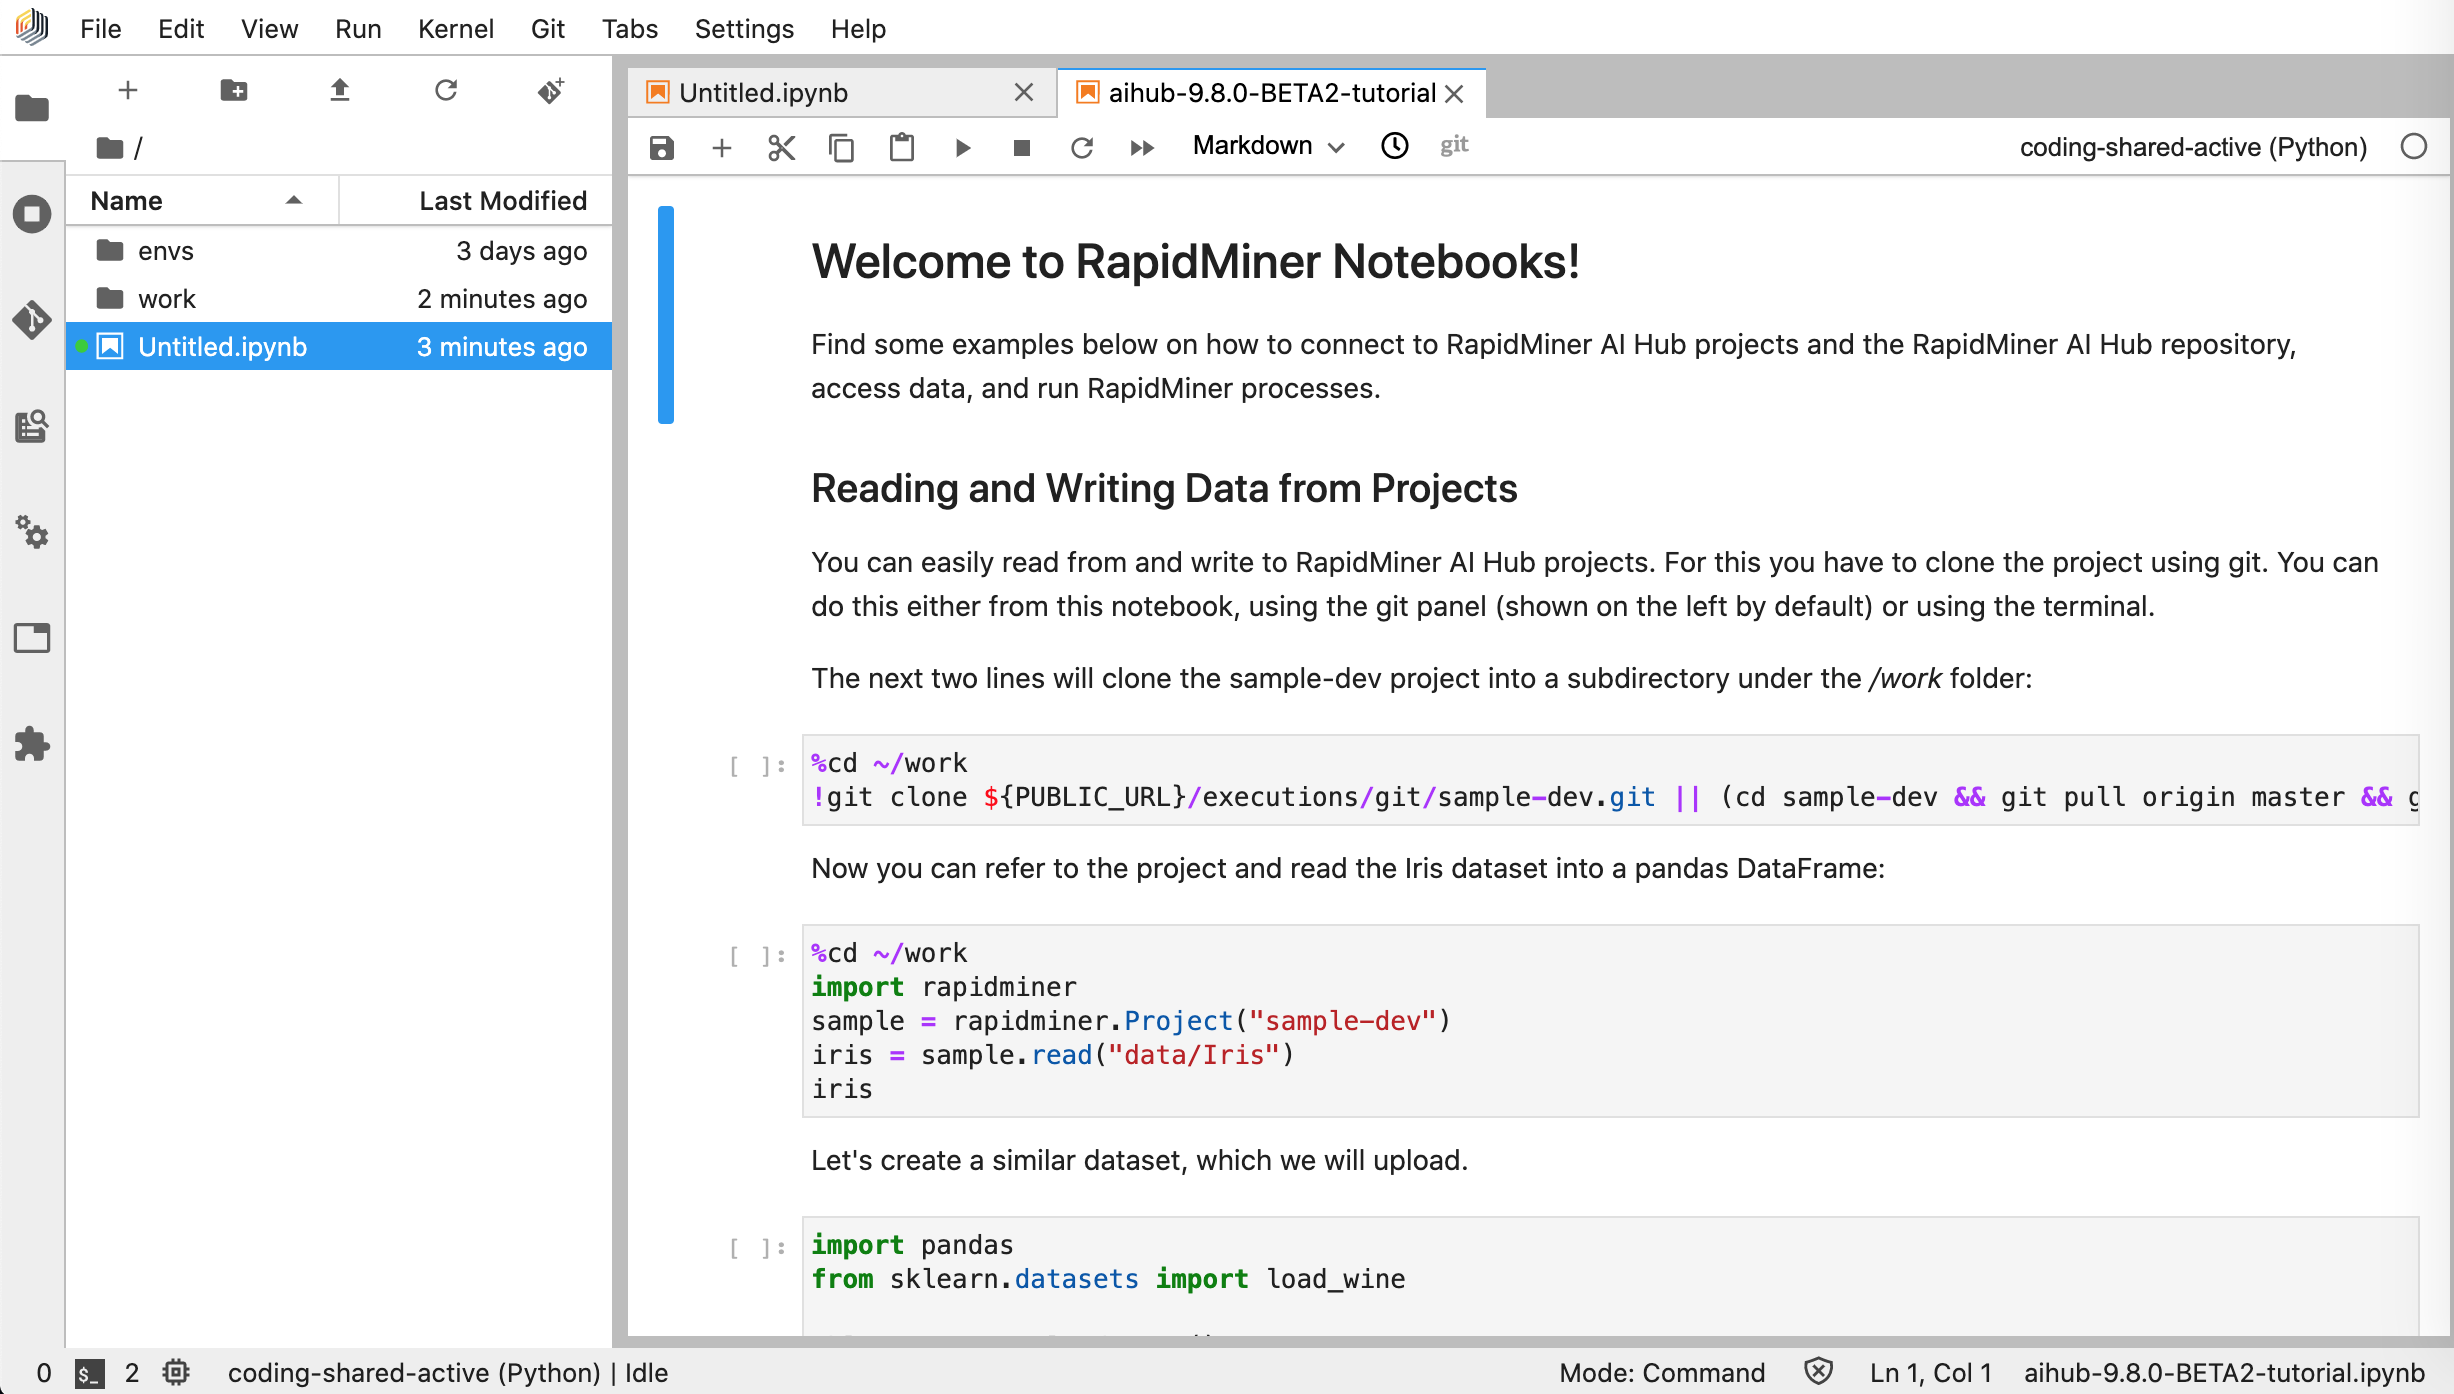
RapidMiner
RapidMiner occupies a different space than the conversational tools, offering a visual workflow designer for users who need more sophisticated analysis without coding.
The platform provides a drag-and-drop interface for building data pipelines and machine learning workflows. You connect data sources, apply transformations, train models, and generate predictions by arranging visual blocks rather than writing code.
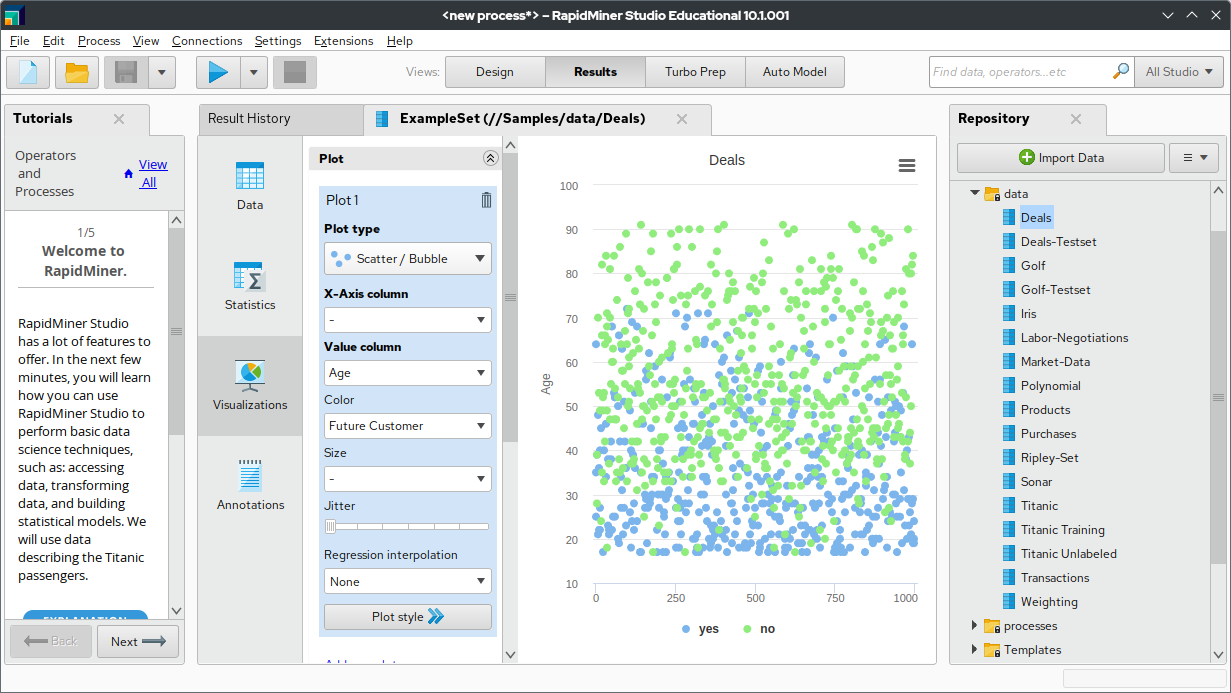
This approach requires more learning than conversational tools but offers more power. You can build complex workflows that combine data from multiple sources, apply multiple transformations, and produce sophisticated outputs. Once built, these workflows can run repeatedly on new data.
The AutoML capabilities make machine learning accessible to non-experts. RapidMiner can automatically select appropriate algorithms, tune parameters, and evaluate performance. You provide the data and define the goal. The platform figures out the technical details.
Use cases include sales forecasting, customer churn prediction, fraud detection, and similar predictive analytics tasks. These go beyond simple data visualization into genuine machine learning applications.
A free tier is available with limitations on data size and processing power. Commercial licenses are available for enterprise use with full capabilities.
RapidMiner makes sense when you need predictive analytics rather than just descriptive analysis. If you're trying to forecast future outcomes based on historical patterns, the machine learning capabilities provide value that simpler tools can't match.
Choosing the Right Tool for Your Needs
| Situation / Need | Recommended Tool | Why This Tool |
|---|---|---|
| Quick conversational spreadsheet analysis | ChatGPT or Julius | Minimal setup, handles common business analysis tasks well. Julius learns your business context over time, while ChatGPT offers broader general capabilities. |
| Enterprise reporting with Microsoft data | Power BI | Natural integration with the Microsoft ecosystem, scheduled refreshes, and broad data connectivity. |
| Presentation-quality visualizations | Tableau | Industry leader in design flexibility and visual polish for impressive dashboards. |
| Turning analysis directly into presentations | Powerdrill Bloom | Integrated “data-to-slides” workflow saves time when regularly creating presentations. |
| Adding AI without changing tools | Google Sheets + Gemini | AI capabilities inside a familiar interface without switching platforms. |
| Predictive analytics and machine learning | RapidMiner | Visual workflow design enables advanced analytics without coding. |
| Combined usage approach | ChatGPT + Power BI + Tableau | ChatGPT for ad-hoc questions, Power BI for recurring operational dashboards, Tableau for stakeholder presentations. |
Getting Started Without Getting Overwhelmed
The best approach is to start with one tool and one specific problem.
- Pick a real analysis you need to do. Something you've been putting off because it seemed too technical, or something that takes too long with your current approach.
- Choose the tool that seems most appropriate based on your existing ecosystem and the nature of the analysis. If you already have ChatGPT Plus, start there. If you're in Microsoft's world, try Power BI. If you want something purpose-built for business analysis, give Julius a try.
- Upload your data and ask your first question in plain English. Don't worry about phrasing it perfectly. These tools are designed to interpret imprecise requests and ask for clarification when needed.
- Iterate from there. Ask follow-up questions, request different visualizations, explore tangents that seem interesting. The conversational nature of these tools means you don't need to plan the entire analysis upfront.
Once you've solved one real problem, you'll have a much better sense of what the tool can do and whether it fits your needs. From there, you can expand to more analyses or try alternative tools if the first choice isn't quite right.
The democratization of data analysis through AI is real. The tools exist, they work, and they're accessible to anyone willing to try them. The only question is whether you'll start using them.
FAQ
What is the best AI tool for data analysis for beginners?
ChatGPT with Advanced Data Analysis is the most accessible starting point for complete beginners. Upload a spreadsheet, ask questions in plain English, and get visualizations and insights. The interface is familiar to anyone who has used a chatbot, and the $20 per month subscription includes many other useful features beyond data analysis.
Can I really analyze data without knowing how to code?
Yes. AI data analysis tools like ChatGPT, Julius AI, and Powerdrill Bloom translate your natural language questions into code automatically. The AI writes Python behind the scenes, executes it, and returns results you can understand. You describe what you want to know, and the tool handles the technical implementation.
Which AI tool is best for Excel data analysis?
Julius AI and ChatGPT both handle Excel files well for conversational analysis. Power BI offers the deepest Excel integration for organizations in Microsoft's ecosystem, with scheduled refreshes and enterprise features. For users who want to stay in a spreadsheet interface, Google Sheets with Gemini adds AI capabilities without changing tools.
Is ChatGPT good for data analysis?
ChatGPT's Advanced Data Analysis feature is genuinely useful for many business analysis tasks. It handles spreadsheets up to about 50 MB, creates professional visualizations, and performs statistical analysis through conversational prompts. The main limitations are that it works best for ad-hoc analysis rather than recurring reports, and results can vary between sessions.
How accurate is AI data analysis compared to manual analysis?
When AI tools work correctly, they're often more accurate than manual analysis because they don't make arithmetic errors or copy-paste mistakes. However, AI can misinterpret questions, use inappropriate methods, or miss context that a human analyst would catch. Best practice is to review AI-generated analysis critically, especially for high-stakes decisions.
What types of data analysis can AI tools perform?
Modern AI data tools handle descriptive statistics, data visualization, trend analysis, correlation analysis, regression, clustering, outlier detection, and basic machine learning. They can clean messy data, merge multiple datasets, and create summary reports. More sophisticated platforms like RapidMiner also offer predictive modeling and forecasting.
Do AI data analysis tools keep my data private?
Privacy policies vary by tool. Julius AI explicitly states that data is never used to train AI models and maintains SOC 2 Type II compliance. ChatGPT's data handling depends on your account settings and whether you've opted out of training data use. Enterprise versions of most tools offer stronger privacy guarantees. Always review privacy policies before uploading sensitive business data.
How much do AI data analysis tools cost?
Costs range from free to enterprise pricing. ChatGPT Plus costs $20 per month including data analysis features. Julius AI offers free basic plans with paid plans starting around $20 per month. Power BI starts at $14 per user per month. Tableau begins around $75 per user per month. Many tools offer free trials to test before committing.
Can AI tools replace data analysts?
AI tools automate many tasks that data analysts previously handled, but they don't replace human judgment, domain expertise, or the ability to ask the right questions. Most organizations find that AI tools make existing analysts more productive rather than replacing them. Non-technical users can now handle basic analysis independently, while analysts focus on more complex problems.
What file formats do AI data analysis tools support?
Most tools support CSV, Excel (xlsx, xls), and common text formats. ChatGPT additionally handles PDFs and JSON. Specialized tools may support database connections, cloud storage integrations, and API data sources. File size limits vary, typically ranging from 50 MB to 512 MB depending on the tool and file type.
Related Articles