For years, the US-China AI gap could be measured in double digits. Stanford's 2026 AI Index, released April 13, puts the current performance lead at 2.7 percentage points.
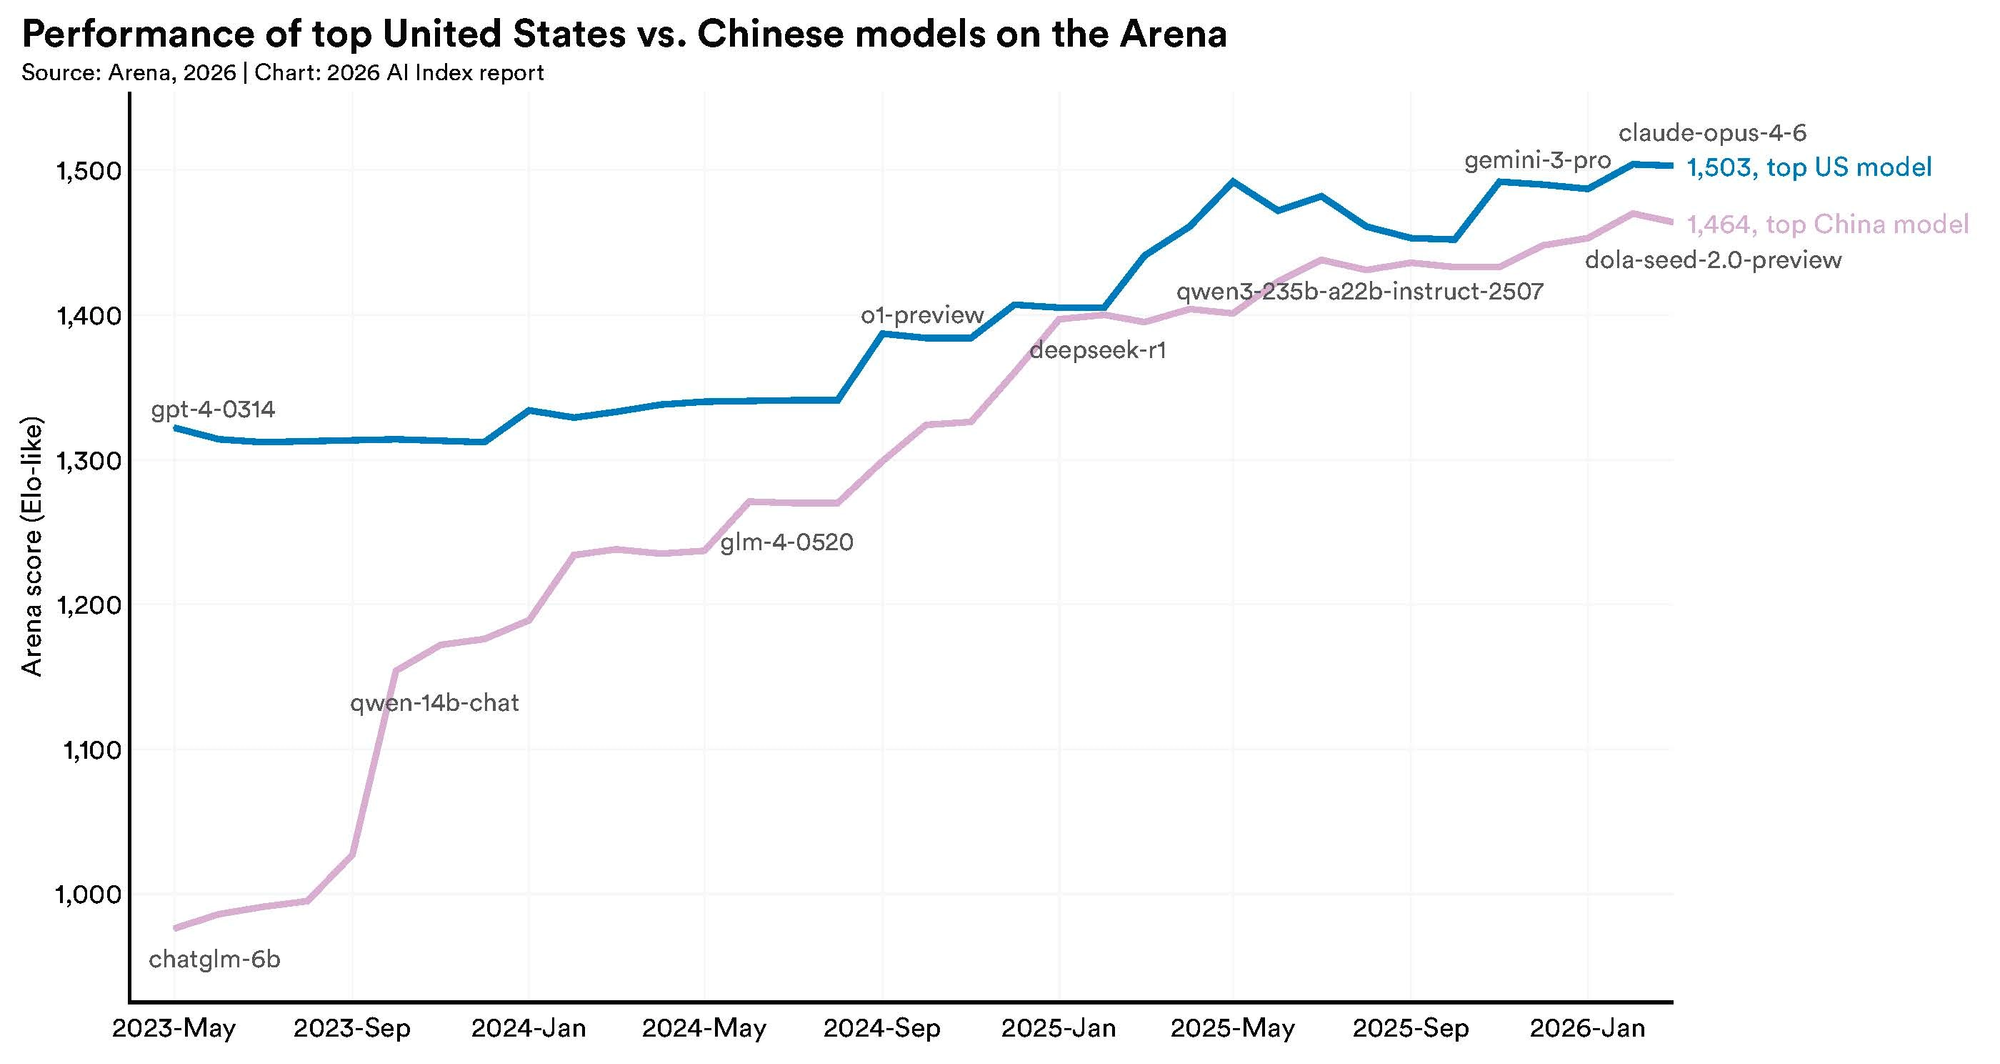
That number comes from a specific measurement: as of March 2026, Anthropic's top model holds a 2.7% lead over the best-performing Chinese model on the benchmarks Stanford tracks.
The gap has not always run in one direction. US and Chinese models have traded places at the top of the performance rankings multiple times since early 2025. In February 2025, DeepSeek-R1 briefly matched the top US model before being surpassed.
A 2.7% lead is real, but it is not the commanding advantage the US held at the end of 2023, when performance gaps on major benchmarks stood at 17.5, 24.3, and 31.6 percentage points respectively on MMLU, MATH, and HumanEval. By the end of 2024, those same gaps had collapsed to 0.3, 1.6, and 3.7 percentage points.
The Stanford report says plainly: "In 2023, leading American models significantly outperformed their Chinese counterparts. A trend that no longer holds."
What the 2026 AI Index Actually Measures
The Stanford AI Index is now in its ninth year, produced by Stanford's Institute for Human-Centered AI. The 2026 edition runs over 400 pages and tracks AI progress across technical capabilities, research output, investment, workforce, policy, and public perception. It is the most comprehensive annual measurement of the field's state, and it draws on dozens of independent data sources including Epoch AI, the International Federation of Robotics, and global survey data.
This year's report does not conclude that China is winning the AI race. It concludes that the race is no longer a blowout, and that the category of competition determines who appears to be ahead.
Where the US Still Leads
Model Output
The US produced 50 notable AI models in 2025, according to Epoch AI data cited in the report. China produced 30. The gap in quantity is real, though it has narrowed from the 40-to-15 comparison the previous year's report recorded.
The US also retains the lead in model influence. Over the past three years, US institutions have contributed the most top-100-cited AI publications. When the rest of the field builds, it still predominantly builds on American research foundations.
Investment
US private AI investment reached $285.9 billion in 2025, according to the Stanford Index, up from $109.1 billion in 2024, and that figure is 23.1 times greater than China's $12.4 billion. The gap is not narrowing in raw dollar terms; it is widening.
The report is careful to flag the limitation of that comparison. The Chinese government channels resources through state guidance funds in ways that do not appear as private investment. Between 2000 and 2023, an estimated $912 billion in government guidance funds were deployed across industries including AI. The true capital differential between the two countries is materially smaller than the private investment numbers suggest.
Infrastructure and Compute
The US controls approximately 75% of global GPU cluster capacity, compared to China's roughly 15%. Following US export controls on advanced chips, America's share of global AI computing power surged from 51% to 74%, while China's fell from 33% to 14%.
US chip manufacturers remain three generations ahead in advanced semiconductor manufacturing. Huawei's best current AI chip, the Ascend 910C, delivers approximately 60% of the performance of Nvidia's H100 for inference workloads. To match a cluster of 100,000 Nvidia B200s, China would need roughly 300,000 Ascend 910Cs, creating compounding challenges in energy consumption and engineering complexity.
Talent
The US is home to more AI researchers and developers than any other country. International talent continues to flow predominantly toward American institutions, with Chinese and Indian graduate students making up the majority of computer science PhDs at US universities. The US attracts 42% of global AI talent overall, and 60% of the top tier.
The flow is slowing, though. According to the report, the US is attracting new AI talent at the lowest rate in over a decade, down 80% in the last year alone. The pipeline that built the US lead is thinning.
Where China Leads or Has Pulled Ahead
Publications and Patents
China accounts for 23.2% of global AI publications and 22.6% of citations. On patents, the comparison is more dramatic: China holds 69.7% of global AI patent grants. China's share of the top-100-cited AI papers grew from 33 in 2021 to 41 in 2024.
The US retains an advantage in the quality and influence of its patents, but China's volume in intellectual property filings signals where the next generation of AI ownership is being established.
Industrial Robotics
China installed 295,000 industrial robots in 2024, compared to 34,200 in the US and roughly 44,500 in Japan. China's share of global robot installations is 51.1%, meaning it installs more industrial robots than the rest of the world combined, and this is not a near-future projection but the current state of physical AI deployment at scale.
AI Adoption
Greater China recorded one of the most significant year-over-year growth rates in organizational AI adoption in 2024, a 27 percentage point increase. By contrast, 83% of Chinese respondents in global surveys believe AI products and services offer more benefits than drawbacks, compared to just 39% of Americans. The US ranks 24th globally in generative AI population adoption at 28.3%.
Benchmark Performance
The benchmark comparison that produced the 2.7% figure measures the top model from each country against each other at a specific moment. On MMLU, the performance gap that stood at 17.5 percentage points at the end of 2023 was 0.3 percentage points by the end of 2024. HumanEval went from a 31.6 point gap to 3.7 points in the same period. For policymakers, the trajectory of that compression matters more than the current endpoint.
The Broader Picture: It Is No Longer a Two-Horse Race
One of the less-discussed findings in the 2026 report is the emergence of third and fourth competitors operating outside the US-China binary.
South Korea has become the world's leader in innovation density, filing more AI patents per capita than any other country. The number of nations with state-backed supercomputing clusters rose to 44, reflecting a global push for AI sovereignty that is expanding the competitive landscape beyond the two dominant powers.
Europe produced only three notable models in 2025, continuing a pattern of underpowered AI output relative to its research base. But the report frames European activity differently: rather than competing on model production, Europe is building the regulatory architecture that will govern AI deployment globally for decades. The EU's AI Act, now in implementation, represents the most comprehensive AI governance framework in the world, and its standards are being adopted as reference points by other governments.
The report also introduces a concern about a new kind of digital divide. South American and Middle Eastern nations lag significantly behind in AI infrastructure investment, and the report suggests those nations that cannot shape AI development are less likely to capture its economic benefits.
What the Report Says About Transparency
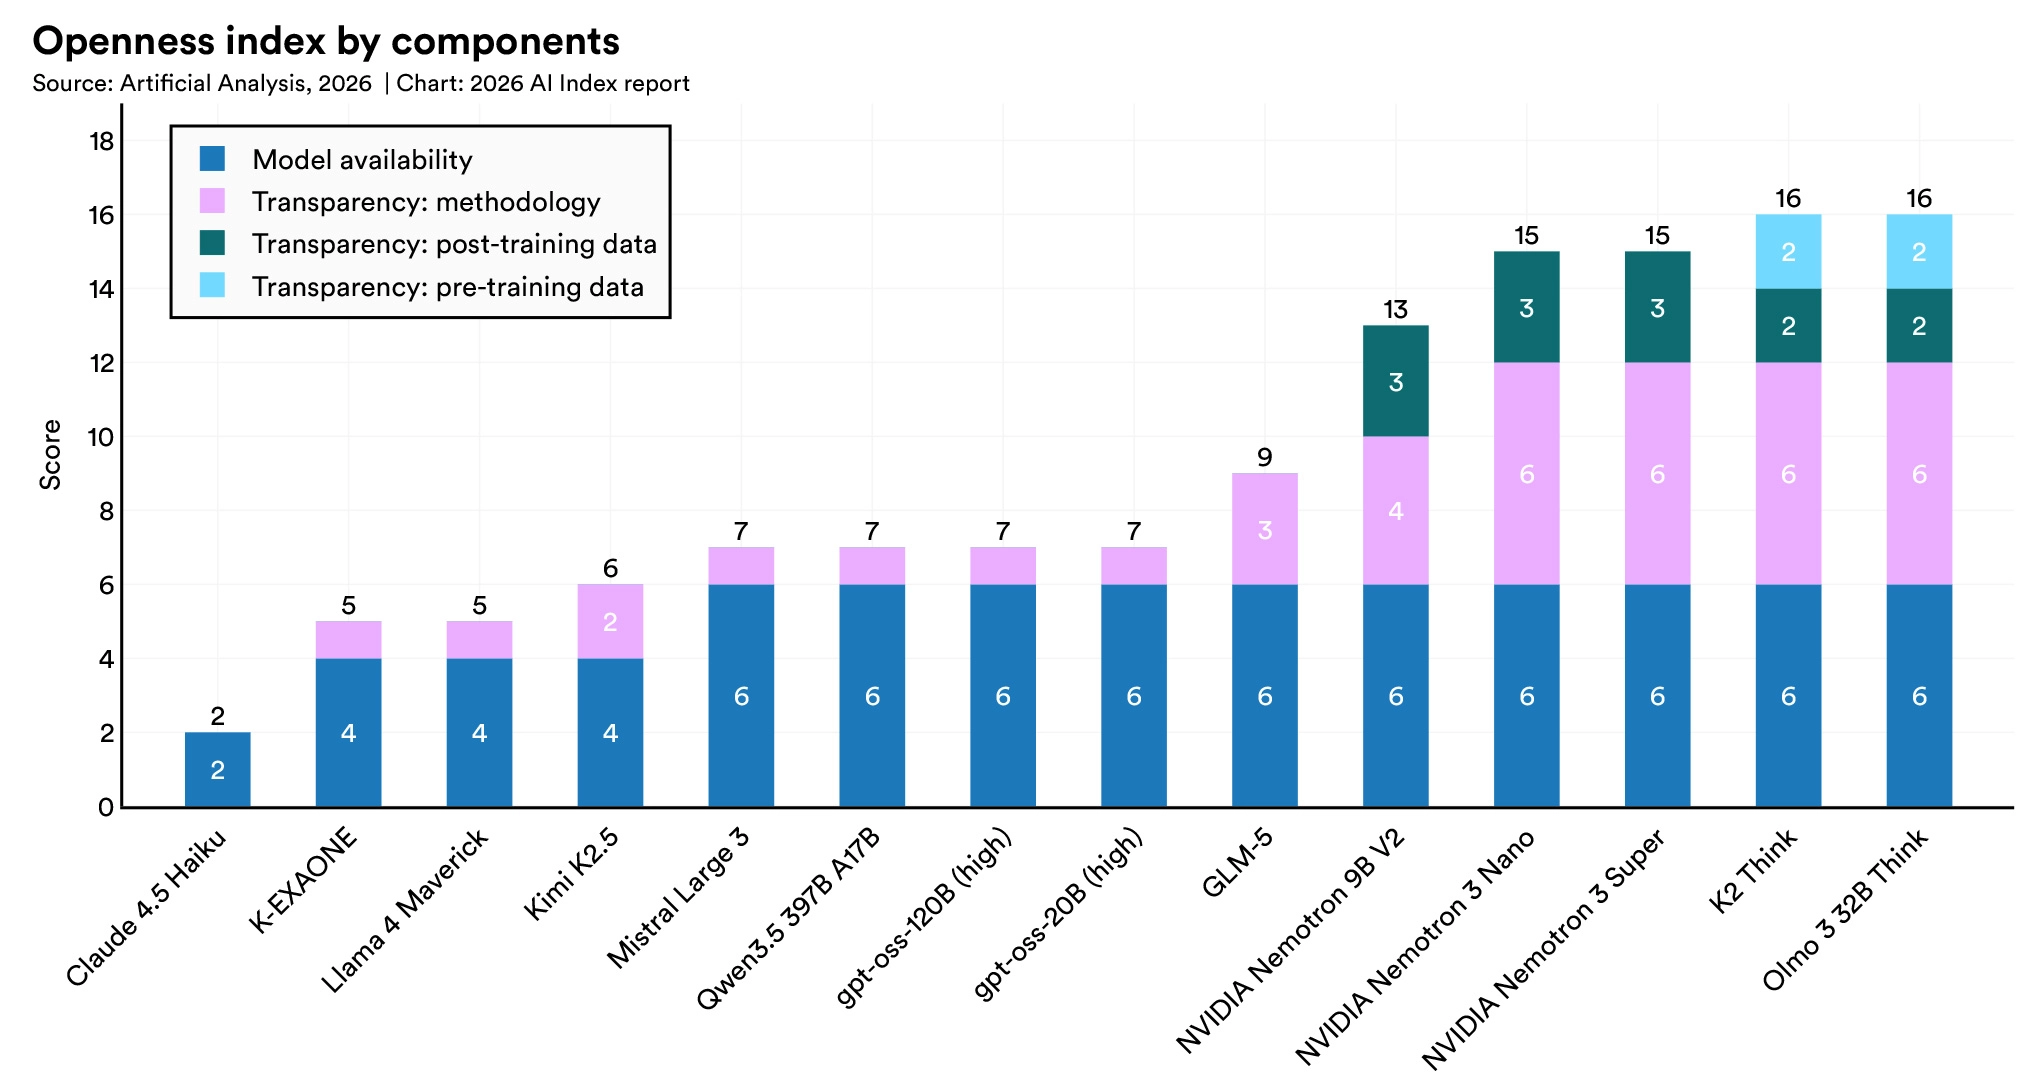
One finding runs against the narrative of inevitable progress: the most capable AI models are now the least transparent.
The 2026 report notes that OpenAI, Anthropic, and Google have all stopped disclosing training dataset sizes, parameter counts, and training duration for their most capable models. Of the 95 most notable models released in 2025, 80 were released without their training code.
This opacity creates a specific problem for the kind of analysis the Stanford Index tries to conduct. The 2.7% performance lead is a benchmark measurement, but what it indicates about actual capability, safety, or real-world deployment fitness is increasingly difficult to assess because the systems being compared are becoming black boxes. Stanford's researchers note that the field "generally lacks measures of how well a system needs to function in a particular setting."
AI industry representatives in congressional hearings have tripled since 2017 as a share of witnesses, while the presence of neutral academics has fallen. The institutions producing the most capable systems are also the institutions with the most presence in the rooms where policy is made.
What Americans Think
Public sentiment data from the Stanford Index contains a finding that deserves attention beyond the technical comparisons: only 33% of Americans expect AI to make their jobs better, compared to a global average of 40%. The US public also reported the lowest trust in government to regulate AI among all countries surveyed, at 31%.
Both of those numbers sit against a backdrop of real economic impact. The report confirms that employment among younger workers in AI-exposed fields has already started to decline. Entry-level jobs in software development and customer support have been reduced, while mid-career and senior positions have held steady or increased.
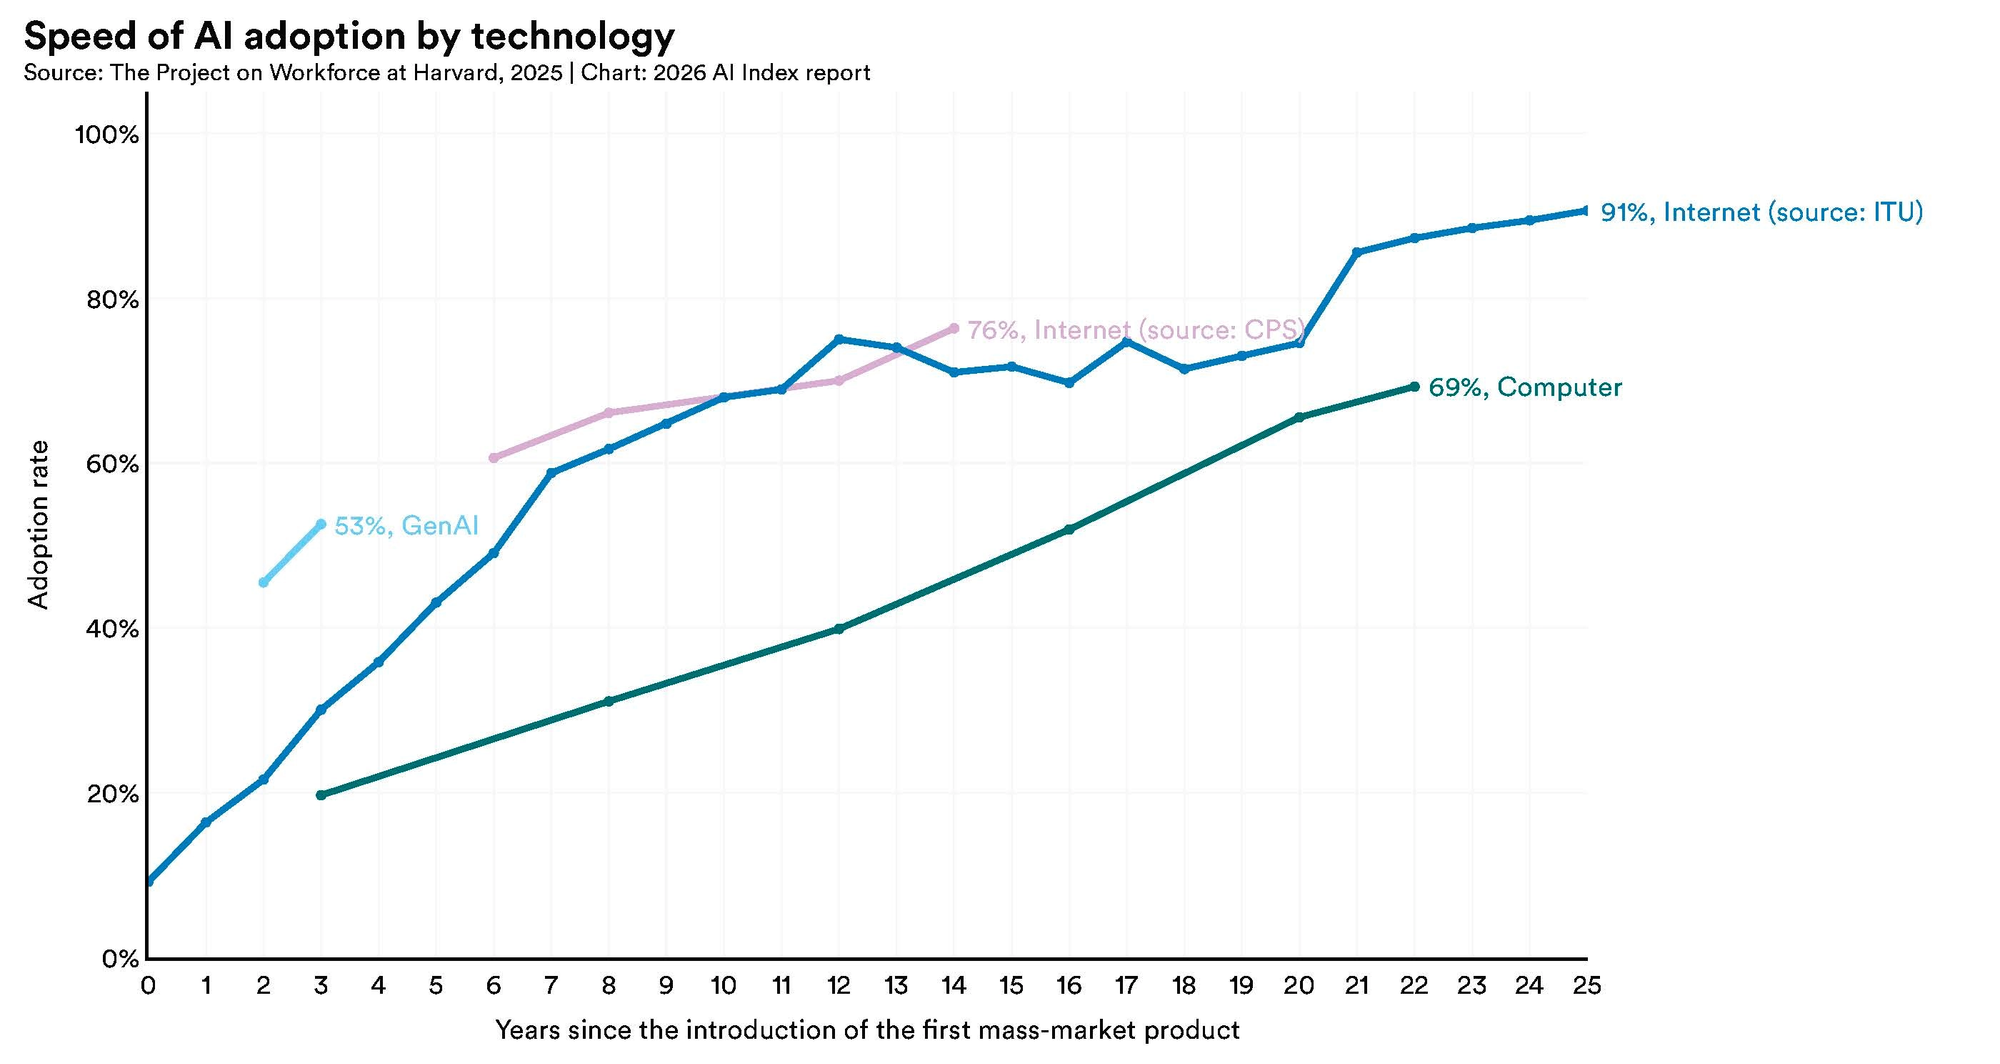
Despite this, the estimated value of generative AI tools to US consumers reached $172 billion annually by early 2026, with the median value per user tripling between 2025 and 2026. Generative AI reached 53% global population adoption within three years, faster than the personal computer or the internet.
The tension between who benefits from AI productivity and who bears the workforce adjustment costs is not a future concern the Stanford Index flags but a present-tense finding.
Conclusion
The 2.7% performance lead is real, and it is also narrower than it has ever been, has flipped direction more than once in the past year, and measures only one dimension of a competition that spans capital, infrastructure, intellectual property, talent, deployment, and governance.
On the dimensions the US leads, the advantages are structural and durable: hardware control, private capital, research influence, and talent concentration. On the dimensions China leads, the advantages are also structural and accumulating: publication volume, patent filings, physical AI deployment, and organizational adoption rate.
The 2026 Stanford AI Index does not declare a winner. What it documents, with 400 pages of data, is that the margin has become thin enough that the answer to who leads depends on which ledger you are reading, and that the answer can change within the span of a single quarter.
Frequently Asked Questions
What is the Stanford AI Index 2026?
The Stanford AI Index is an annual report produced by Stanford's Institute for Human-Centered AI, now in its ninth year. The 2026 edition, released April 13, 2026, runs over 400 pages and tracks AI progress across technical capabilities, research output, investment, workforce, policy, and public perception. It is considered the most comprehensive independent annual measurement of global AI development.
What does the 2.7% US lead over China actually mean?
As of March 2026, the top US model (Anthropic's Claude Opus 4.6) leads the top Chinese model by 2.7% on the benchmarks Stanford tracks. This is a point-in-time measurement that has fluctuated: DeepSeek-R1 briefly matched the top US model in February 2025. In 2023, the US lead on key benchmarks ranged from 17.5 to 31.6 percentage points. The compression to under 3% over two years is the significant finding.
Where does China lead the US in AI?
China leads in AI publication volume (23.2% of global output), patent grants (69.7% of global grants), industrial robot installations (51.1% of global installations versus the US's roughly 3%), and organizational AI adoption growth rate. On benchmark performance specifically, the gap is near parity after collapsing from double-digit leads in 2023.
Where does the US still hold a significant AI advantage?
The US leads in private AI investment ($285.9 billion in 2025, 23.1 times China's $12.4 billion), control of global GPU compute (approximately 75%), notable model production (50 vs China's 30 in 2025), and AI talent concentration (42% of global AI researchers, 60% of the top tier). US patents are also considered to have higher real-world impact than China's, even though China produces more by volume.
What does the Stanford report say about AI model transparency?
The report flags a concerning decline in transparency. OpenAI, Anthropic, and Google have stopped disclosing training dataset sizes, parameter counts, and training duration for their most capable models. Of the 95 most notable AI models released in 2025, 80 were released without training code. The most powerful models are now among the least transparent systems the field has produced.
Is the AI race still primarily between the US and China?
The 2026 report notes it is no longer a two-horse race. South Korea leads the world in AI patent filings per capita. The number of countries with state-backed supercomputing clusters rose to 44. Europe produced few models but is building the regulatory architecture that governs AI globally. The report also warns of a new digital divide forming between nations with the infrastructure to participate in AI development and those without it.
Related Articles